The latest insights and information on the Australian cropping market as of February 2026*
Rally in US grain values and slow local grower selling support prices despite $A
A modest rally in international grain values combined with slow local grower selling has supported Australian grain prices since the end of 2025, despite a surge in the value of the $A.
US grain values (wheat +8pc, corn +4pc, soybeans +10pc and canola +12.5pc) have rallied due to a weaker $US and increased export demand. US wheat exports for the 2025/26-year exports are +16pc and corn +33pc compared to 2024/25.
European values have been more subdued due a firmer Euro and intense competition from a large Argentinian wheat crop in Europe’s traditional north African and Middle Eastern markets weakening export demand for French and German wheat. Black Sea grain values have rallied (US$5 to 10/t) due to complicated logistics, high fuel costs and slow grower selling.
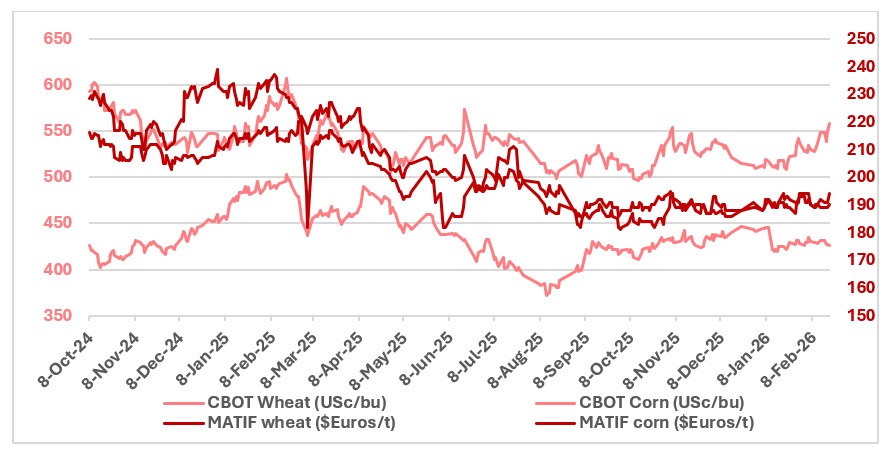 This chart shows US and French wheat and corn nearby futures price. Source: LSEG Workstation.
Are funds nervous?
The recent rally in US futures has been largely attributed to speculative funds buying back their sold positions. These funds have held short positions in grains for most of 2025, piling in mid-last year on estimates of a record US corn crop. Despite worsening grain market fundamentals (increased global grain end stocks estimates), funds have failed to drive the market significantly lower with the weakening $US working against them. Speculative funds seem to have position fatigue or may be betting that a continued decline in the $US will be supportive of grains.
Other factors that could be making funds nervous about holding short positions include the impact on northern hemisphere crops of the coldest winter in at least five years, and ideas that the USDA is overstating the size of last year’s US corn crop and understating damage to Chinese corn stocks from flooding late last year.
New crop conditions mixed but stocks cap upside
In China, crops are in winter dormancy, but in recent months, winter wheat and rapeseed fields in the southeast of the country have experienced a shortage of rainfall. Rain forecast in the coming weeks will be critical for the continued development of these crops. NDVI’s (normalised difference vegetation index - satellite assessments of vegetation vs normal) remain well below last season and the five-year average across key Chinese provinces (e.g. Henan, Shandong, Hebei), consistent with delayed winter crop emergence versus prior seasons (late plant due to flooding).
A cold snap across most of Ukraine following a thaw has led a crust of ice to form on fields that may damage winter wheat and rapeseed crops.
But countering concerns with Chinese and Ukraine crops are indications that most other northern hemisphere crops are in good shape. Recently Sovecon increased its estimates of 2026/27 Russia’s wheat production by 2mt to 86mt, while another Russian crop watcher - IKAR - is estimating new crop production at 86 to 91mt. Russian Deputy Prime Minister Dmitry Patrushev said about 97per cent (pc) of Russia’s winter wheat crop is in normal condition, compared to 87pc at the same time last year.
Crops across France are in the best condition in at least the past three years with 91pc of soft wheat, 88pc of winter barley, and 87pc of hard wheat rated in good or excellent condition. In the US, winter wheat conditions also remain relatively favourable. In Kansas, 61pc of the crop is rated good to excellent, although in Montana only 19pc of crops fall into those categories. The main concern is moisture deficits, with about 43pc of US winter wheat areas experiencing some level of drought heading into spring.
In India, the world’s second-largest wheat producer behind China, a robust monsoon season has seen Rabi wheat sowings increase and despite forecasts of a hot February, yield and production estimates are strong. Recently the Indian Government allowed 2.5 million tonnes of wheat exports, lifting a ban that had been in place for three years due to a succession of poor Indian crops.
While new season wheat conditions are mixed, global wheat values will be kept in check by large wheat ending stocks outside China and India which are projected at 135.4 million tonnes in 2025/26.
This is the highest level in eight years.
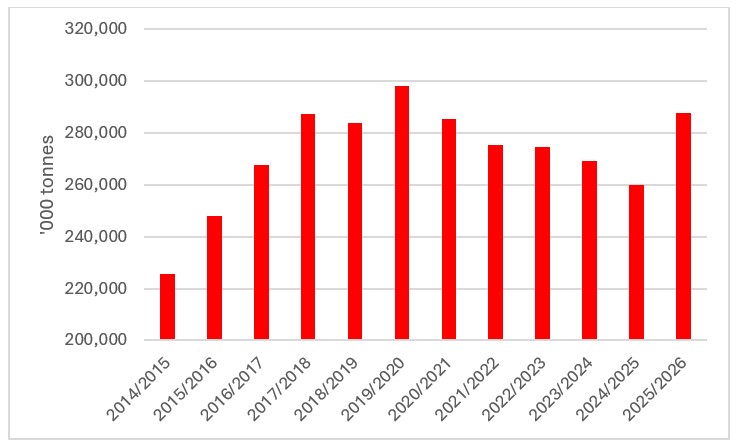 This chart shows global wheat stocks. Source: USDA.
Argentine wheat caps global values
A key feature of international wheat markets since late last year has been vigorous competition from Argentina.
Argentinian wheat crop estimates rose from 19mt to 28mt during the growing season, raising export projections from 13mt to 18mt. The increased availability of cheap Argentine wheat reduced the pace of European wheat exports and will increase European wheat availability in Australia’s traditional wheat export window, ahead of the next northern hemisphere harvest. China received its first shipment of Argentine wheat on 10 February.
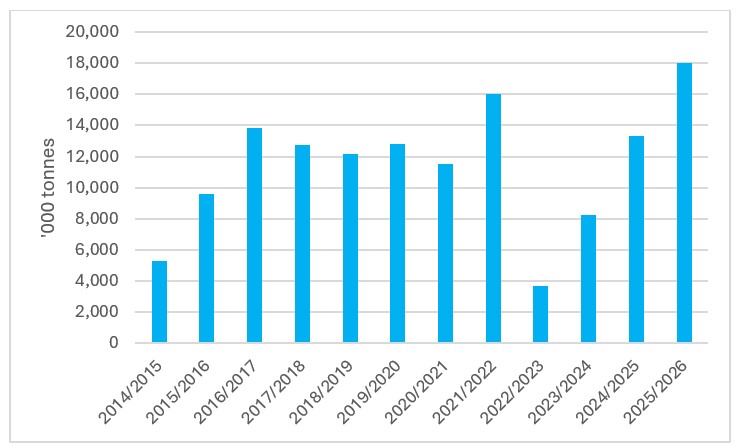 This chart shows Argentine wheat exports for 2025/26. Source: USDA.
Expana has lowered its forecast for European Union soft wheat exports in the 2025/26 season by another 1.2 million metric tons this month, reducing it to 27.6 million, citing tough competition on world markets. It said, whilst competition from Russian and Ukrainian wheat is less intense this year, competition is very fierce from the US and southern hemisphere countries. Russian airstrikes on Ukraine's Black Sea ports late last year have reduced their capacity and have slowed Ukrainian exports.
Despite increased competition from Argentine wheat, Australian wheat exports have started the export season strongly up 44pc November to December. This is due to importing countries use higher quality Australian wheat to blend with lower quality Argentine wheat. Australian exporters are reporting increased inquiry for Australian wheat as Argentine supplies clear the market, suggesting a further increase in export demand for Australian wheat ahead of the northern hemisphere harvest in June.
In local feed grain markets, slow grower selling has seen wheat prices firm across the north to $345/t Downs. Wheat prices across southern feed markets are firming slowly as harvest pressure from high yielding late season red wheat crops from the western district clear the market.
In export zones, wheat values have ranged between $320-330/t FIS WA port since harvest.
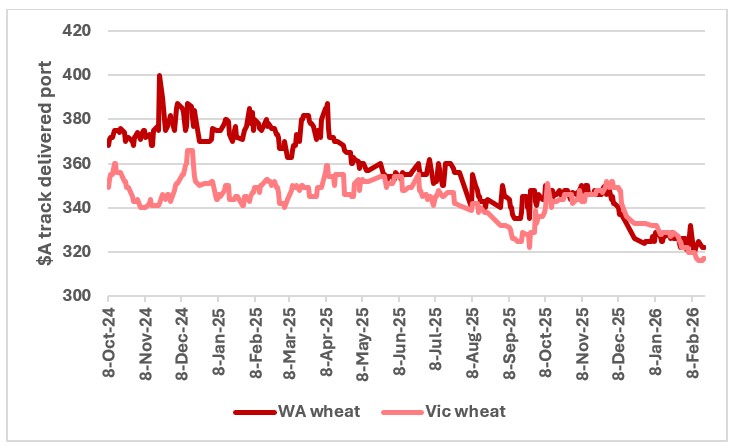 This chart shows wheat prices for WA and Victorian ports. Source: CGX
Outlook: Australian wheat prices should grind higher and become increasingly volatile over the next few months as import demand for Australian wheat picks up ahead of new crop northern hemisphere harvest. However, increased stocks held by major exporters will keep values in check.
Barley is a demand bright spot in grains
One of the few bright spots in terms of global grain demand this year has been barley. Strong global demand for barley has driven EU barley exports to a 10-year high this season. Reversing the usual price structure, European feed barley is attracting better prices than milling wheat which is rare air for barley. French barley prices are +$6Euros/t ahead of wheat and rising.
Supporting EU feed barley exports has been strong feed demand in the Middle East and China, limited availability of Black Sea barley and weak brewing demand in Europe. Due to drought, Turkey has switched from a barley exporter to an importer this year.
With European barley stocks tightening, Chinese buyers have ramped up purchases from Australia in recent months, taking 1 million tonnes of Australian barley per month since harvest, about double last year’s monthly volumes. These sales have been driven by high corn prices in China (up 10pc since October) which should underpin continued Chinese demand for Australian barley in coming months.
It looks like Australia could hold the whip hand in global barley markets in the next few months ahead of the next northern hemisphere harvest. EU is almost out and Black Sea exports are slow (weather, port attacks, high fuel costs and slow grower selling). Argentina might have a bit to sell but they are not significant barley producers. The main competition to Australian barley is likely to be from Canada, however, Australia has a significant freight advantage into MENA (Middle east and North Africa).
In key export port zones, feed barley has moved to evens with milling wheat $320-325/t FIS WA ports.
Similarly in local feed grain markets barley is trading near wheat values at $345/t Downs. Barley was trading at a discount to wheat at harvest encouraging feeders to include it in summer rations (barley is also preferred to wheat in summer months).
In the southern feed zone, barley will be increasingly difficult for exporters to get out of the growers’ hands as demand continues to build domestically as dry conditions bite, with more livestock moving into containment across SA, Victoria and Southern NSW.
Outlook: Australian barley prices will increase over the next few months as export demand shifts from Europe to Australia ahead of the northern hemisphere harvest. High levels of local livestock feeding and uncertain seasonal conditions across south-east Australia will mean that barley will remain tightly held by Australian growers and this will contribute to a firmer price trend in coming months.
Sorghum supported by increased Chinese buying
Despite US sorghum regaining access to the Chinese market, demand for Australian sorghum remains solid as China seeks to maintain diversity its supplier base (recently it has received sorghum shipments from Brazil for the first time in over 10 years). Chinese buyers have booked about 45 cargoes of US sorghum due to high domestic Chinese corn prices after flooding damaged harvested corn late last year.
Substantial rain over parts of the Central Queensland sorghum belt has been welcomed, falling at the ideal time for recently planted sorghum. The rain has interrupted those still harvesting sorghum in border regions of NSW/Qld but harvest there is mostly done and moving towards the inner Downs and north-west slopes and Liverpool Plains of NSW.
Sorghum into Newcastle is back up to $356/t track as exporters build positions with Newcastle the main export hub given Brisbane port is focussed on chickpeas. Good competition for a large nth NSW and Liverpool Plains sorghum crop (move away from cotton plantings) has prices in Newcastle at a $14/t premium to track Brisbane.
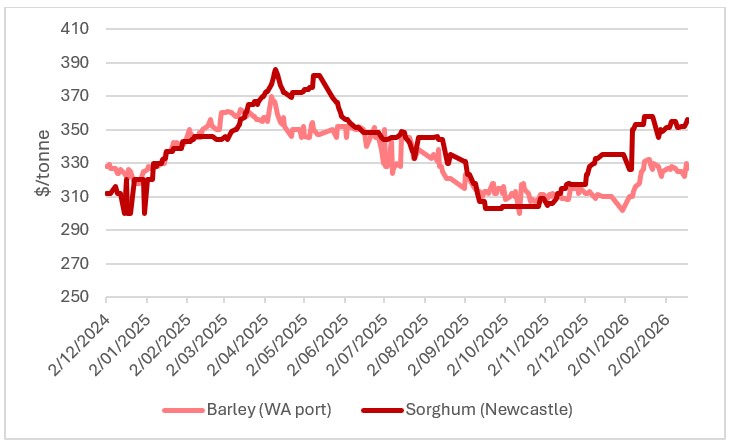 This chart shows prices for barley and sorghum at WA ports and Newcastle. Source: CGX.
Outlook: Sorghum prices should remain firm as harvest selling pressure dissipates and as Chinese export buying ticks away.
Oilseeds remain a political football
President Trump’s announcement of further Chinese purchases of US soybeans has supported global oilseed markets in the past month. Trump announced an additional 8mmt of Soybeans could be purchased by China this marketing year.
Traders suggest there is no commercial logic for China to expand US soybean purchases with cheaper Brazilian harvest supplies available. The gesture largely seen as political to smooth the path for a productive meeting between the US/China in April. The spread between Brazilian and US is around $50/tonne FOB basis.
Private Chinese crushers have not bought a single cargo of US soybeans in the season that began in September. Crush margins in China's main processing hub of Rizhao have been negative since August.
South America is around 30 pc through the harvest of a record soybean crop (+4 pc on last year’s record) with strong early season yields across northern and central Brazil more than offsetting the impact of a hot and January on yields in southern Brazil and Argentina.
Also supporting oilseeds was the latest US biofuel tax credit proposal that decreed clean fuel production credits would only apply to feedstock used that is produced or grown in the US, Canada or Mexico. The major beneficiaries are expected to be US soy oil (up +25 pc since the start of the year) and Canadian canola oil. The more demand for Canadian canola oil there is from the US, the more Canadian canola seed that will be crushed in Canada, and the less Canadian canola that will compete with Australia in European and Asian export markets.
China lets Canadian canola back in
In January, Canada and China announced it had struck a trade deal that will cut Chinese tariffs on Canadian canola from 84 pc to 15pc by 1 March 2026 in exchange for lowering tariffs on Chinese electric vehicles. As part of this, China has extended its anti-dumping probe into the Canadian canola saying it will make a fair and final ruling on 9 March .
Following Prime Minister Mark Carney's visit to Beijing, Chinese importers secured up to 10 Canadian canola cargoes potentially displacing Australian exports. These shipments, totalling around 650,000t, represent over 10pc of China's canola imports in 2024 and about 26pc of its total imports last year. Canadian canola values have increased around $CA80/tonne since the announcement.
Prospects for Australian canola in China may hinge on the conditions of the Chinese new crop. Of the reported 600,000 tonnes China purchased from Australia last year, only 124,000 tonnes has been shipped so far.
According to the Chinese Agricultural Ministry, China’s rapeseed crops were recently damaged by cold and wet weather. The unfavourable conditions occurred over Hubei, Hunan and Jiangxi. These areas account for 35pc of China’s rapeseed production according to the USDA. Any damage is supportive of import demand.
European demand is set to pickup
Between October and December 2025, Australia exported 1.3 million tonnes of canola compared to 1.5 million tonnes a year earlier. In December, Australia exported a total of 0.6 million tonne, with 76pc sent to Europe, while 10pc was sent to China.
A much larger European Union (EU) rapeseed crop has reduced early season demand for Australian canola from the EU. For the year so far, EU rapeseed imports had reached 2.67 million tonnes, down 38pc year on year. The European Commission estimates the 2025/26 EU rapeseed harvest at 20.16 million tonnes vs 16.77 million tonnes the previous year, making the EU less dependent on imports. However, the EU will still need to import around 5 to 6 million tonnes of rapeseed this year and with export restrictions on Ukrainian canola and Canada’s focus on China, Australia should dominate EU rapeseed imports over the next few months in the leadup to next European harvest.
The use of rapeseed oil derived from Canadian rapeseed is restricted to biofuel production in the EU due Canada producing genetically modified seed. The introduction of a 10 pc export duty on Ukrainian rapeseed to encourage domestic processing and limit the export of unprocessed raw materials has led to significant restrictions on exports out of Ukraine.
Australian canola values have been recovering after taking a hit from the rise in the $A and were $740/tonne (GM) and $690/tonne (non-GM) FIS WA port with the spread to non-GM narrowing considerably from nearly $150/t to just $50/tonne.
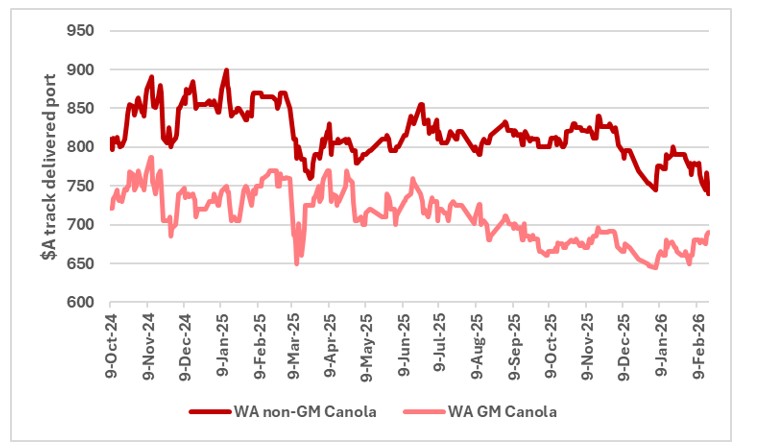 This chart shows WA port prices for GM and non-GM canola, Source: CGX
Outlook: Despite indications that Chinese demand for Australian canola will be restricted due to the availability of Canadian canola, Australian canola should sell well into the EU over the next few months ahead of its new crop with the export duty imposed on Ukrainian exports.
Indian buying picks up ahead of harvest
Australia’s exports of chickpeas and lentils surged in December with shipped 588,122t of chickpeas and 410,805t of lentils shipped during the month. The extent of India’s buying surprised the market, given the import tariffs currently applied.
Agpulse Analytica reports large Indian pulse import purchases ahead of likely import policy changes from 1 April 2026. Market participants are expecting an import duty hike for lentils but not for chickpeas where a supply shortfall is expected to prevent the Indian government from raising import duties. Unlike lentils, production increases in chickpeas have not kept up with growing Indian demand.
A heat wave is forecast for February across India, however, good soil moisture should limit any significant crop damage ahead of harvest in March.
Demand from the sub-continent generally rises as stocks diminish ahead of its Rabi harvest in March and in lieu of increased demand through Ramadan. This year’s Indian monsoon has been solid, and a large sub-continent pulse crop is expected.
Lentils and chickpeas have enjoyed a post-harvest rally, with lentils up about $90/t to $690/t Rupanyup for Jumbo/Nugget and an $85/t discount to Nipper/Hallmark. Chickpeas have risen $30-40/t to $635/t Brisbane, $600-610/t Downs packers and $565/t nth NSW.
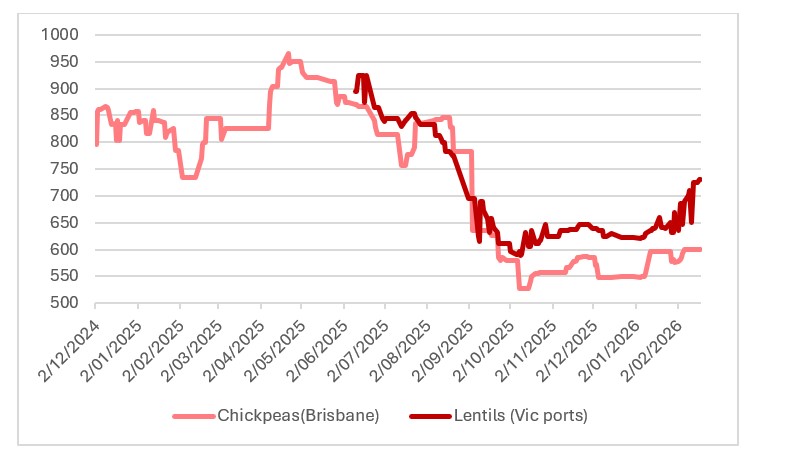 This chart shows port prices for chickpeas and lentils. Source: USDA.
Faba bids have improved on some fresh demand emerging, with values around $450/t delivered Geelong. Interest in faba beans is coming from those feeding livestock with the strong $A nobbling any export interest from the price sensitive Egyptian market. In the north, faba beans are selling around $390-400/t ex-farm Downs equivalent.
Canada’s agreement with China to eliminate the 100pc import tariff on peas, effective 1 March 2026, is already having a positive impact on the global pulse market. A year ago, Canadian peas were $12 to 14/bu, now they are around $8/bu. Over the past five years, Canada exported an average of 1.6 million tonnes of peas to China annually, valued at $743 million. Loss of the Chinese market and 30pc tariffs in India have caused Canadian yellow pea values to drop about 50pc which has contributed to the global downturn in pulse values.
Outlook: Chickpea and lentil prices will ease over the next month as the Indian Rabi harvest commences in March.
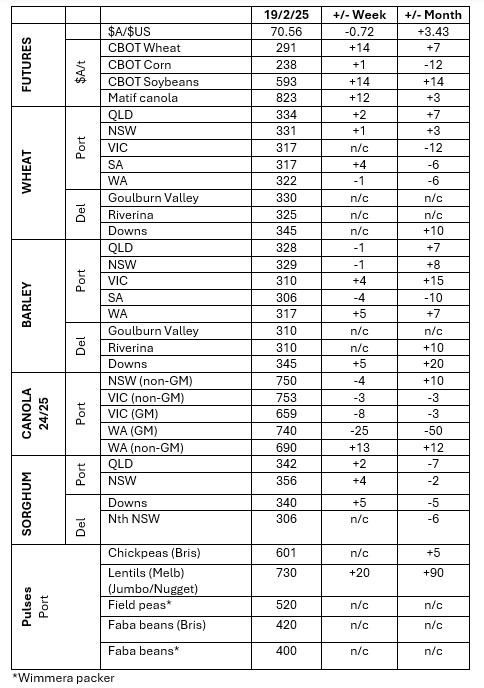 This table shows grower trade bids for grain in major Australian grain markets. Source: Clear Grain Exchange.
The information contained in this article is given for the purpose of providing general information only, and while Elders has exercised reasonable care, skill and diligence in its preparation, many factors (including environmental and seasonal) can impact its accuracy and currency. Accordingly, the information should not be relied upon under any circumstances and Elders assumes no liability for any loss consequently suffered. If you would like to speak to someone for tailored advice relating to any of the matters referred to in this article, please contact Elders.