Read the latest insights and information on the Australian cattle market for July 2026*.
Grassfed production system on steroids drives price recovery
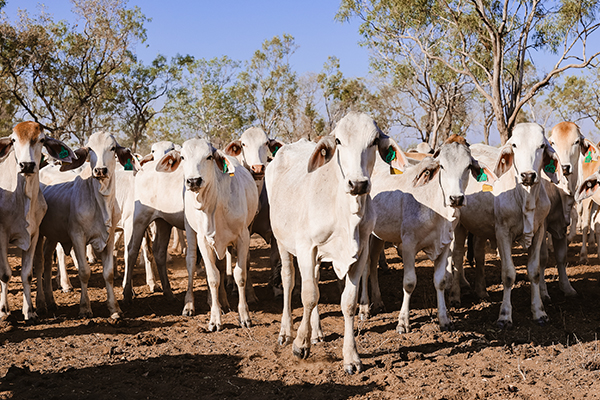
The past three months have highlighted Australia’s predominantly grassfed production system, which has a grain finishing component, turning grass into beef that is mostly sold into a global markets (Australia exports over 80 per cent of our beef production).
The predominance of our grassfed production system means that our cattle markets can sometimes behave independently of the global beef complex because our costs of production are governed by grass availability, varying widely, and depending on seasonal conditions.
Since March, our markets have largely been influenced by local factors. First, we ran out of grass, then conditions turned. Now we have abundant grass to feed, creating a rollercoaster for cattle prices.
The change in conditions since the end of April is of a scope that we may not see in another generation. There is hardly a region across Australia that is not firing– the mild winter has put our grassfed production system on steroids.
Given graziers are basically getting their feed for free they have the flexibility to hold onto animals to feed to heavier weights (withholding cattle from processing) and outcompete the feedlot sector as a fattener.
A consequence of our grassfed system running the show is that competition for cattle from graziers can squeeze processing and feedlot margins. Processors are feeling the pinch of higher prices. There is talk that some east coast processors are looking at dropping weekend shifts and considering four-day weeks, while feeders are facing red ink and the prospect of leaving pens empty.
Export market conditions toughen
In contrast to local cattle markets, beef export market conditions toughened again last week, with the announcement that we have officially filled 90 pc of our beef quota to Korea. New sales to Korea effectively will be subject to the safeguard tariff of 24 pc (vs 5.3 pc in-quota tariff) with the remaining quota already dealt with beef on the water.
Junie Lin, Expana’s Asia-Pacific specialist said in her APAC beef report published Friday that “the broader Australian beef export sales pace levelled off under downward pricing pressure this week. While some sellers-maintained firm offers amid high cattle costs, a series of price-taker transactions surfaced well below mainstream market levels. Australia’s export sales to Asia were “instead directed predominantly toward Japan this week”.
Attention will now turn to how Brazil reacts to it nearing safeguard levels into China. Expana reporting on Brazilian sales into China said “a mid-June lull has firmly taken hold as the buying window for pre-quota Brazilian beef effectively shuts. Spot market activity ground to a near-complete halt this week since most buyers had already completed their strategic volume bookings ahead of the looming quota exhaustion.”
In recent weeks, we have seen Brazilian exporters start to pivot towards the US market, lowering offers to win business. Expect an official announcement as early as next week that Brazil has filled 80 pc of its China quota which effectively means that the quota will be filled by product already on the water.
Queensland direct-to-works begin to ease
Queensland direct-to-works heavy steer values have started to ease, influenced by falling international beef values as increased availability of Queensland supplies start to come to market. Beef Central reports that some larger lines of company owned cattle from northern regions have started to hit the market, bringing down rates from a peak of $8.40/kg dressed weight (dw) to $8/kg dw.
National saleyard values have held up better at $4.60/kg liveweight, supported by southern markets where supplies remain seasonally constrained. Over the next quarter, supplies of heavy steers should become more relaxed as Queensland turnoff hits its stride and as southern supplies increase seasonally through spring.
Recently, Ripley Atkinson from StoneX said “the numbers of bullocks in northern Australia has increased by 56 pc or 507,000 head in the past 12 months as per MLA’s Beef Producer Intentions Survey. A clear indication that northern producers are opting to retain cattle to grow out to kill weights, to utilise the strength of the season.”
Slaughter cattle are more directly influenced by current international market conditions which look set to toughen over the coming quarter as our export opportunities narrow, given restrictions placed on Australian beef exports into China and Korea.
Heavy steer values will come under pressure
With Chinese and Korean export restrictions set to bite from July onwards, Australian beef exporters face a challenging quarter. As processing margins begin to get squeezed, slaughter ready cattle values will come under pressure.
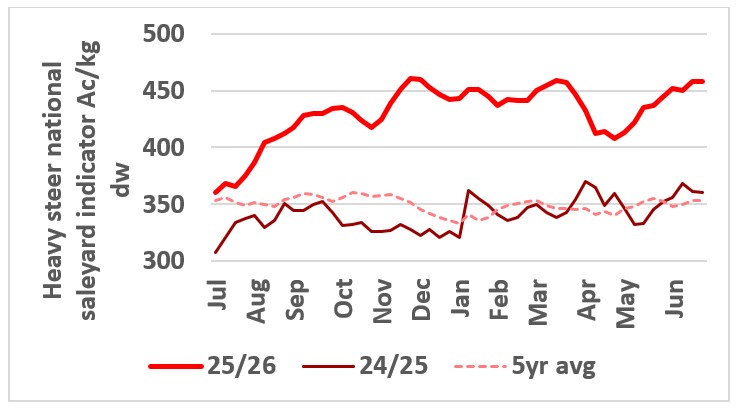 This chart shows the national saleyard indicator price for heavy steers in 24/25 vs 25/26 and five-year average. Source: MLA.
Significant fall in cow beef export values to the US
Australian 90CL cow beef export prices to the US fell 7USc/lb last week to 370USc/lb. This was its lowest price this year and the heaviest weekly fall witnessed in some time.
Although most of the impacts on Ac/kg returns were cushioned by the lower Australian dollar, competitive tension is building in the US with ample offerings from both Oceania and South America, and US buyers comfortable with their current coverage and not interested in extending given changing market dynamics.
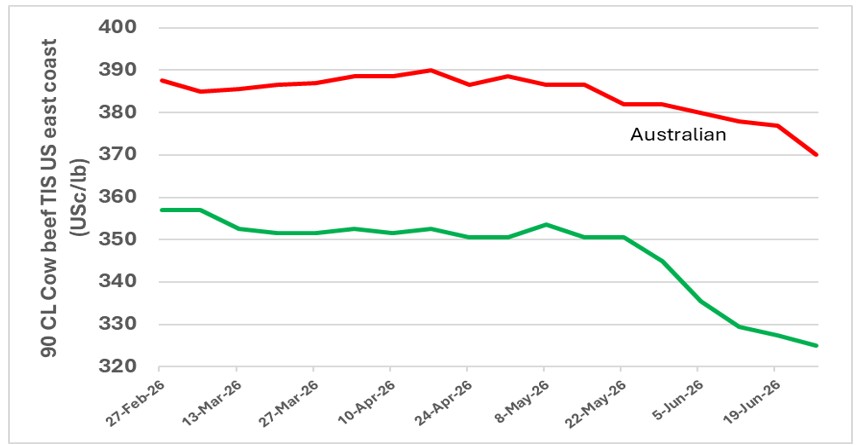 This chart shows 90CL cow beef values TIS (trimmed imported steer) in USc/lb, US east coast. Source: USDA.
As Steiner reports, “US beef sales start to slow down after Labor Day while simultaneously domestic US lean beef supply starts to improve. Added to that dynamic, Australia has now filled its Chinese beef quota, and Brazil will soon have to deal with the same issue. This is now clearly affecting buying sentiment.”
Increased Brazilian competition to squeeze margins and pressure local cow values
With Brazilian exporters starting to shift focus away from China as the safeguard quota trigger looms, conditions in international manufacturing beef markets will worsen during the next quarter, placing pressure on local cow values.
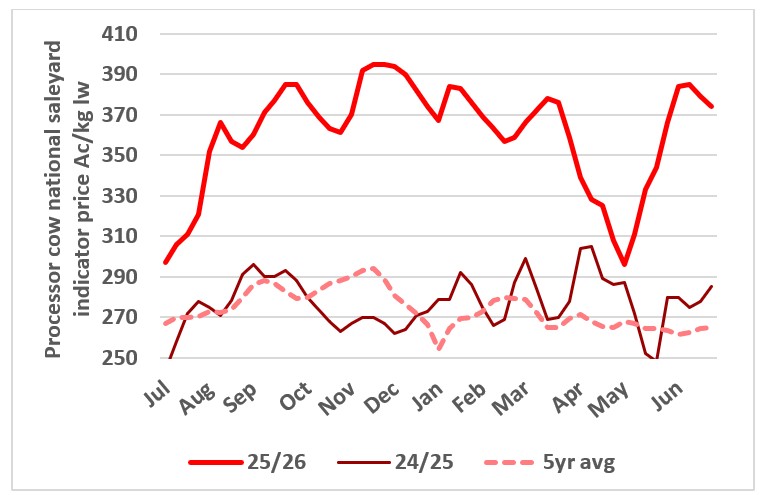 This chart shows the national saleyard indicator price for cows 24/25, 25/26 and five-year average. Source: MLA.
In contrast to the last update, where we indicated widening processor margins and a seasonal slowing in supply would support a recovery in local cow values, there has been a change in the processing climate. The recovery in cow prices and lower international cow beef values have been squeezing margins and flattening domestic cow prices in recent weeks.
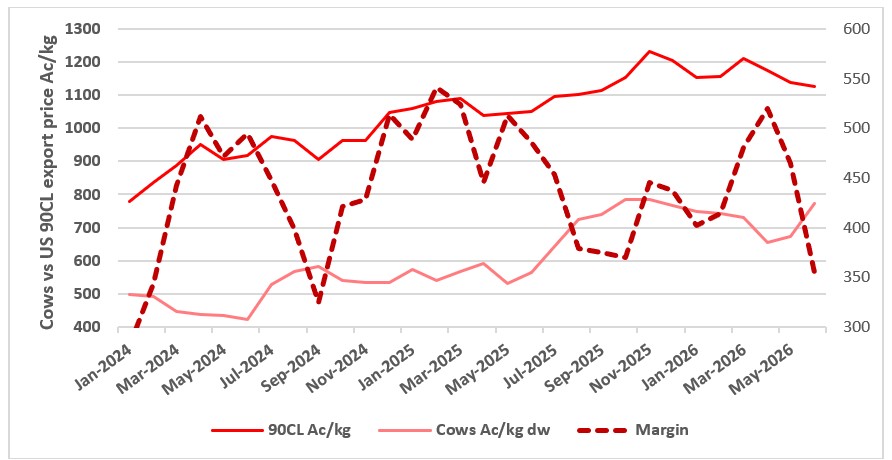 This chart shows the 90CL US cow beef export price and the national saleyard cow indicator price in Ac/kg and the margin. Source: USDA.
Feeder cattle values remain vibrant
Feeder cattle values have led the local market in recent times as feedlots restock after a big turnoff to fill quotas into China and Korea. This, plus increased feedlot capacity over the past couple of years has driven feeder cattle demand the past few months.
Current feeder cattle values are more reflective of what the markets expect the future value of cattle to be in late 2026 or early 2027 when China and Korea quotas open again. Last week, flatback cattle were trading around $5.40 to $5.50/kg Downs with Angus premiums of 50 to 80c/kg and Euro cross 30 to 50c/kg. With the shortage of suitable southern type feeders supporting these premiums. Many of these cattle are part of branded beef programs and as such demand is somewhat more price inelastic compared to commodity type ‘flatback feeders’.
Angus feeders that left the New England region to go to Queensland in early autumn are just starting to run and are being supported by buying to fill feedlots to target China re-opening in 150 days. Prices should top out at $6 to $6.50/kg. Feeder heifer discounts are starting to squeeze in as restockers start to tap this market.
Increased restocker activity on feeder cattle categories is compressing feeding margins. For the first time in several years, feeders are talking about leaving pens empty or carrying losses to maintain throughput. The 100 day grainfed flatback feeder contract price for October is $8.85c/kg dw and has only risen moderately compared to the steep rise in feeder cattle values.
While conditions in international beef markets look set to toughen through Q3 2026, mainly due to export restrictions to China and Korea, underlying market conditions remain strong, particularly in northern America. Despite some sectors feeling the pinch (namely QSR – quick service restaurants), overall beef demand in the US remains on a very solid footing. For Q1 2026, the retail beef demand index hit the highest point in over 25 years, registering a 7pc gain from the previous year.
With US production continuing to weaken (5 pc year to date) and no rebuilding in sight, solid import demand will continue. Australian exporters would be eyeing the US market to take increased supplies of chilled grainfed product in H2 2026 to help fill the gap left by lower domestic US production. Currently, Brazil exports are predominantly frozen and Brazilian competition in chilled beef export segment is limited.
Middle market beef demand remains strong
With US beef production down 5 pc for the year to date there are opportunities for higher quality chilled beef in some segments in north America and in global export markets where the US is our biggest competitor.
For the year so far US exports into key north Asian markets (Japan and Korea) are down by around 15 pc.
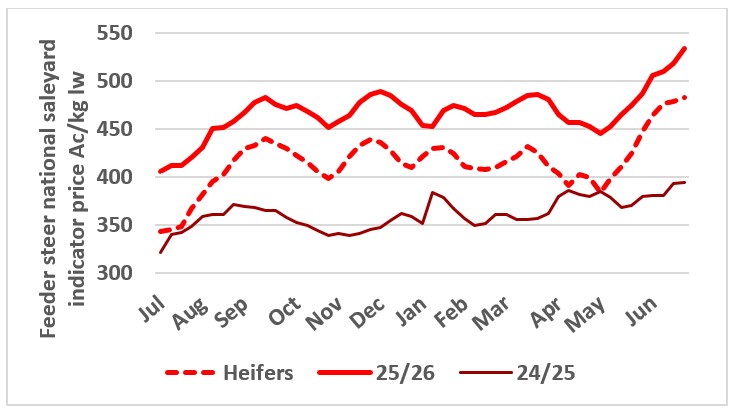 This chart shows the national saleyard indicator price for feeder steers and heifers in 25/26 and 24/25. Source: MLA.
Restocker market moves into overdrive
A very mild start to winter and abundant rainfall across most Australian livestock regions has created the best restocker conditions since the end of the millennial drought. The past couple of months have since created genuine and widespread interest from restockers for the first time in at least three years.
Graziers have responded by increasing saleyard offerings of light weaner type cattle which have been selling at +$6/kg lw for steers with heifers at a 50c/kg discount. Southern restockers have been particularly active over the past couple of months with strong unseasonal pasture growth through June. Dual purpose fodder crops are well advanced with some restocker demand from graziers wanting to graze crops to slow them down.
The past week has seen some gaps starting to show up in the weaner cattle market. This reflects the number of lighter weaners offered chasing the big money available. Saleyards were full of them last week, with buying support coming from NSW and Victoria.
Once thing to bear in mind is that calving and marking rates have been exceptional and when supplies start to hit the market they will come earlier and at heavier weights than in recent years.
Restocker activity fires up
The past few months has seen genuine and widespread restocker interest, mainly from southern areas that has benefitted from unseasonal early winter pasture growth.
Prices have peaked for now as the weather cools, supplies of quality weaners at good weight should be plentiful this year from spring onwards.
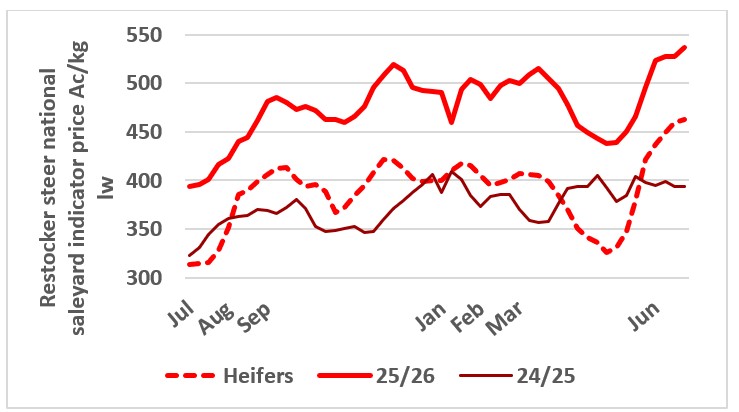 This chart shows c/kg lw national saleyard indicator price for restocker steers in 24/25 and 25/26. Source: MLA.
From the rails
Read what Elders livestock representatives from around Australia are saying about the markets in their regions.
"The northern market copped a bit of a check last week at Charters Towers. Hard to identify why or whether it was a bit of a one-off?"
"There was a few less cattle in the market which highlights, how tight it is and if a major operator doesn't look like getting a loadout and decides to not operate, it has a dramatic effect on the market, particularly on Brahman cattle, which dominates the northern run. Prices were 20 to 25 cents cheaper.
"Heavy steers were cheaper too but most cattle were full mouth Brahman steers that might have been high 500kgs. Cattle that aren’t going to hit the top of anyone's grid, but they were a bit subdued.
"There was a store sale last Friday with 2000 head and it was significantly cheaper. You get a couple of feedlotters and backgrounders not operating, and you get on a roller coaster where, you know, they fill up, empty out, fill up, empty out, and you catch it on the on the wrong week and it can have a detrimental effect.
"Brahman Steers under $4 again, which, you know, they were $4.25 and 30 only a week or two ago.
"Live export market out of Darwin is still solid. It's bucking that trend, largely because not many Queensland cattle have been coming across and they're focused pretty much solely on the available supply of the NT. $4.05 and a bit better for a couple of isolated auctions plus sales in the week, snuck over that $4.10.
"It appears that the southern job has eased a little bit but nothing like these lighter cows. If they're going to be paying current rates for cows, they want to make sure that they've got plenty of weight. And that's not what we have in nth QLD. Brahman cows out of this country you are only getting a 220-230kg carcass versus the efficiency of killing a 600kg cow from the south.
"There's talk of the rain in the upcoming week across that western line, which, could prove a bit interesting if it just puts the brakes on supply for a little bit. Everything seems finely tuned.
"One of our agents out at Blackhall this week said the feed is unbelievable. One month of winter gone and there is still green flag through all this buffalo country. We’ve only got one more proper cold month of July to go and then we're out into a bit of sunshine.
"Feeder cattle are very vibrant sitting around $5.45 to $5.50 the Downs.
"The weaner job copped a bit of a check last week. There are some gaps starting to appear in the market, particularly in tick areas with fat cattle and store cattle. It's nowhere near as vibrant as the clean country." - Paul McCormick, Livestock Manager, Customer Solutions.
Queensland saleyard market indicators c/kg lw | ||||
| 3/07/26 | +/- week | +/- month | +/- year |
| Heavy steer | 414 | 427 | 437 | 335 |
| Processor cow | 342 | 341 | 373 | 283 |
| Feeder steer | 509 | 501 | 489 | 395 |
| Restocker steer | 543 | 545 | 510 | 401 |
| Restocker heifer | 469 | 462 | 427 | 306 |
Source: MLA
"There's a lot of inquiry or demand for that grassfed yearling trade steers they’re sitting north of $10/kg dw which is no surprise as Northern New South Wales normally supplies a lot of those cattle at this time of year, that aren't there this year due to seasonal conditions."
"Angus feeders $6 or thereabouts, it's flying along.
"The heifer equivalent 400-500kg black heifer, you are looking at $5.40 to $5.50.
"Southern supplies will probably start to kick in around August/September. Seasonally, we've had a good turnaround and a fair percentage of the state, but it'll take time before we see any numbers." - Nick Hannaford, Livestock Manager Northern Region.
"A few processors shutting for seasonal maintenance. Prices are good with most stock within 20c/kg of each other. Supply of suitable stock is tight and its going to be a quiet winter." - Peter Homann, National Livestock Manager.
NSW saleyard market indicators c/kg lw | ||||
| 3/07/26 | +/- week | +/- month | +/- year |
| Heavy steer | 458 | 466 | 468 | 383 |
| Processor cow | 389 | 391 | 390 | 307 |
| Feeder steer | 581 | 573 | 519 | 431 |
| Restocker steer | 569 | 578 | 568 | 401 |
| Restocker heifer | 517 | 498 | 460 | 338 |
Source: MLA
"The south is good. Going into another damp week, plenty of rain to come through the week, so it'll be very interesting as to how wet the country starts to look by the end of this one." "Cows are very good. Last week $4 to $4.40/kg. Heavy steers up to that sort of $5.20/kg. Heavy heifers are generally about 30 cents behind that. "The store sale on Naracoorte last week pretty much reflected what Mount Gambier did a few weeks prior, but the feeders were particularly strong and your feed on cattle. Not frightened to pay the money for a 520 or 540kg steer to put in the feed pen. Feeders were sort of $5.50 to 5.90/kg. "Anything that was lighter than that $5.70 to $6.90/kg and your feeder heifers were 40 to 50c/kg behind the steers at $4.70 to $5.30/kg and lighter heifers $5.40 to $5.90 /kg "Feeders are setting the pace, and the blacks are pulling a premium. "Calving's been good, the calves look magnificent, it's going to be very interesting what weight we've got in them come December for calf sales." - Laryn Gogel, Livestock Sales Manager, South Australia. SA saleyard market indicators c/kg lw | ||||
| 3/07/26 | +/- week | +/- month | +/- year |
| Heavy steer | 471 | 505 | 478 | 419 |
| Processor cow | 409 | 419 | 397 | 334 |
| Feeder steer | 532 | 527 | 508 | 405 |
| Restocker Steer | 523 | 547 | 486 | 382 |
| Restocker heifer | 494 | 512 | 470 | 344 |
Source: MLA.
“Winter temperatures have been above average with few frosts which has encouraged pasture growth across the state. However, this week’s forecast rain and snow may test things."
“Very little saleyard activity at this time of year, with most prime cattle sales are over the hooks with program yearling and grassfed Jap steers $9/kg dw up 20c/kg plus in a week. Quality beef cows in the saleyards making $4/kg plus which is a 20c/kg rise from last week. Works are under the pump numbers wise probably a month earlier than usual. They generally take a week off in September for maintenance.” - Gavin Coombe, State Livestock Manager, Tasmania.
Tasmania saleyard market indicators c/kg lw | ||||
| 3/07/26 | +/- week | +/- month | +/- year |
| Heavy Steer | 407 | 424 | 394 | 330 |
| Processor cow | 363 | 392 | 351 | 301 |
| Restocker steer | 504 | 380 | 416 | 302 |
Source: MLA.
"More moisture around the traps in the last week from 30 to 60mm, depending on what part of the state you're in. Some water has started to run into some dams, but it needs to keep raining."
"We had a frost this morning. We've been getting one a week for the last three or four weeks, but this is probably the best one we've had. So, it is getting to that time of year, where the frost will counteract what good some rain does.
"This cattle job's flying, little black steers made nearly $7/kg, somewhere in Gippsland.
"Feeders are at $5.50 to $5.60 up to $6/kg, anything around that, but there's getting few and far between them.
"There are lightweight calves coming out just purely chasing the money. Most of these cattle don’t need to be sold but they're just taking the money." - Nick Gray, State Livestock Manager, Victoria/Riverina.
Victoria saleyard market indicators c/kg lw | ||||
| 3/07/26 | +/- week | +/- month | +/- year |
| Heavy steer | 498 | 492 | 488 | 416 |
| Processor cow | 402 | 412 | 413 | 319 |
| Feeder steer | 512 | 508 | 484 | 397 |
| Restocker steer | 470 | 481 | 458 | 374 |
| Restocker heifer | 444 | 428 | 438 | 338 |
Source:MLA
“More rain that favoured the inner wheatbelt areas 15 to 25mm with some parts of the Great Southern needing more rain to start filling on farm water storages. Esperance is looking good. Canola is just starting to come into flower. Cropping season is set up well if it keeps raining."
“The cattle side of things is quiet. Prices have remained extremely strong across all the cattle classes. A few more pastoral cattle coming to Muchea in the last couple of weeks. More of those store type steer and heifers which are selling well. All the other sales around the place are normal for this time of year volumes are down, prices are up.” - Michael Longford, Livestock Sales Manager, Western Australia.
WA saleyard market indicators c/kg lw | ||||
| 3/07/26 | +/- week | +/- month | +/- year |
| Heavy steer | 452 | 420 | 363 | 280 |
| Processor cow | 344 | 368 | 350 | 233 |
| Feeder steer | 496 | 488 | 430 | 360 |
| Restocker steer | 506 | 390 | 371 | 201 |
| Restocker heifer | 506 | 403 | 423 | 199 |
Source: MLA.
*Disclaimer – important, please read:
The information contained in this article is given for general information purposes only, current at the time of first publication, and does not constitute professional advice. The article has been independently created by a human author using some degree of creativity through consultation with various third-party sources. Third party information has been sourced from means which Elders consider to be reliable. However, Elders has not independently verified the information and cannot guarantee its accuracy. Links or references to third party sources are provided for convenience only and do not constitute endorsement of material by third parties or any associated product or service offering. While Elders has exercised reasonable care, skill and diligence in preparation of this article, many factors including environmental/seasonal factors and market conditions can impact its accuracy and currency. The information should not be relied upon under any circumstances and, to the extent permitted by law, Elders disclaim liability for any loss or damage arising out of any reliance upon the information contained in this article. If you would like to speak to someone for tailored advice specific to your circumstances relating to any of the matters referred to in this article, please contact Elders.