Large sheepmeat kills set to decline steeply through winter
The realisation that the days of heavy flock reduction and large lamb numbers are quickly coming to an end has caught the processing sector off guard and sent sheepmeat prices to record levels through the past month.
The vagaries of the season meant that those who have struggled to put weight on old season lambs are now being rewarded. Most who shore lambs and fed through to autumn in the hope of better prices were disappointed. As one Elders agent pointed out spring is the new winter, meaning winter supply is being filled by old season lambs who have struggled to gain weight. Plus, the poor seasonal conditions (from mating through to lambing and weaning) mean that there are no new season lambs ready in spring, creating a gap in supply.
Weak sheepmeat prices and sustained poor seasonal conditions have seen producers cull flocks hard. One Elders agent says amongst his clients there would be no 5-year-old ewes left in flocks and 3 and 4-year old ewe numbers have been culled by 20 to 30 per cent (pc). The result is that in some areas around 20 to 30 pc less ewes may have been joined this season.
Ewes joined early (last October/November) and lambed in February/April were mostly joined in good condition. Depending on the area and if the ewes were supplementary fed, they achieved reasonable marking and weaning rates - some close to normal. The variance in weaning rates will be quite large, with ewes joined in average condition producing well below normal weaning rates.
Expect the central-west of NSW and above, into southern Queensland (as well as the western Riverina Hay-Ivanhoe) to be the major suppliers of the first winter sucker lambs. In the next few weeks lambs will go onto fodder crops. The top draft of suckers will be ready late August/September with the balance of lambs either being fed on depending on the spring feed situation or sold as stores to feedlotters or as light lambs for the MK trade.
Given the experience of last year, there will be a reluctance to shear lambs and feed on, as there are good prices available for store and light lambs. The cost and work of getting lambs to heavier weights is not being rewarded by processors.
Processor reluctance to offer early forward contracts has seen direct to work contract rates at $9 to 10/kg cw lag saleyard quotes $10 to11/kg cw (although some better yields achieved on hard fed lambs has meant that some returns are equivalent). By the end of June, we will see the largest proportion of contracted stock move through the system. July is looking very exposed for the processor.
Welcome rain through the Riverina and central-west of NSW over the last month has improved the seasonal outlook. It should allow the genuine late winter/spring lambers to avoid the very poor results that many had feared. Through the western district of Victoria and south-east SA however, there is genuine concern that weaning rates will not match marking rates as ewes running out of feed don’t seem to be mothering lambs too well.
Processors were too late in offering forward contracts to attract many takers and have exposed themselves to market forces of supply and demand. All the major export processors are chasing lambs and competing with the local supermarket trade. The market is still searching for the point of resistance where processors deem lambs too expensive and withdraw from the market. But with planned seasonal shutdowns over the next few months and talk that smaller operators will reduce shifts, processors demand is likely to ease, and rates pull back.
For mutton, multiple factors have contributed to mutton prices launching higher:
- lower numbers due to the high kills of recent years,
- producers spending money on feed to maintain core flocks rather than continuing to cull breeding stock,
- the lack of supply from Western Australia.
Similar to lamb, there will be point of resistance where processors wind down operations rather than continue to operate at a loss.
Talking to processors there are very few markets where sheepmeat demand is unaffected by price. In most cases Australian imported sheepmeat competes with indigenous flocks, and although better quality, there is a price point where it becomes too expensive.
Even in our own domestic market there will be a point where consumers will demand less at a certain price point. Interestingly our large supermarket chains have not adjusted their prices - half legs of lamb retailing for $12 to 15/kg - which has been the case for most of the year. This time last year however, when spring lambs were available, prices were between $9 to 12/kg for a limited period.
Talking to some processors, although some have enjoyed a period of prosperity in processing, conditions in sheepmeat processing have been increasingly difficult for the past 12 months. This indicates that they are having trouble passing on higher livestock prices to export customers. Processors may be prepared to absorb losses for a period (particularly larger multi species operators); however, history shows that we are close to a historical resistance point in terms of sheepmeat pricing. Some processors estimate their marginal breakeven cost on lamb at around $9 to 10/kg cw.
Bear in mind that the major processors would be killing a lot of their own stock and using saleyards to top up kills. Therefore, their average price point would be less than what they are paying in the yards. The point is don’t expect these prices rises to continue at the current pace, as some processors will decide to cut back on kills to drive prices back to more sustainable levels.
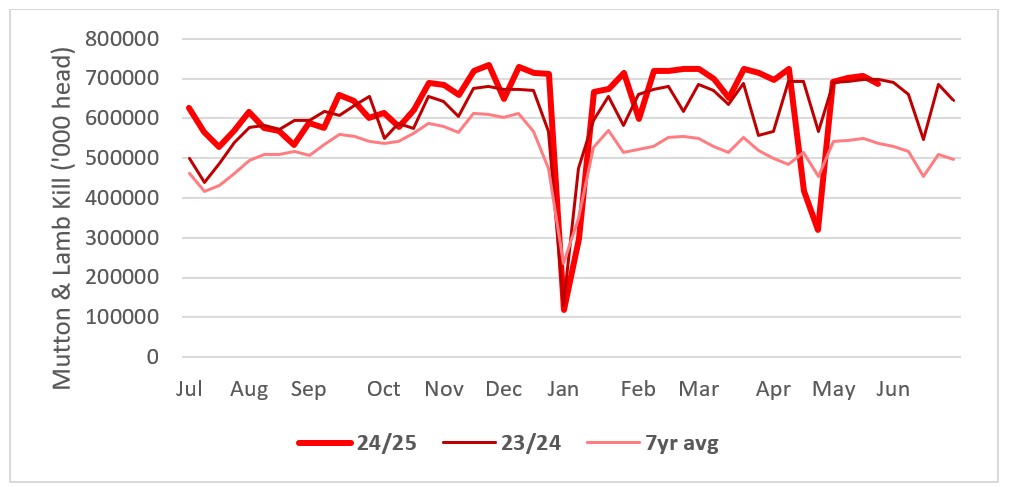 Chart shows combined lamb and mutton kill 24/25 vs 23/24 and 7year average. Source: MLA
US lamb prices strengthen
Since December, American demand for Australian lamb has strengthened. Prices have risen moderately at around 20 pc, although not at the same pace as local heavy lamb values. These price rises almost mirror exactly the increase in US domestic beef values across the same period, suggesting that pricing between the two may be linked.
The US currently takes around a quarter of Australia's exported lamb, with Australia supplying nearly 80pc of all imported lamb in the US. This accounts for 70pc of total lamb consumption in the US.
The supply of heavy lambs suitable for the US export market is likely to be challenging, given the season and higher cost of being supplementary fed. As a result, the premiums paid should widen compared to other lamb types.
Given the dominance of Australian lamb in the US market, and the market segments that it occupies, the US may be one export market where Australian lamb exporters have some price influence.
Many producers have commented that if seasonal conditions don’t improve significantly, they will be selling store lambs or lighter MK style lambs, rather than shearing and supplementary feeding to obtain heavy trade or export weights.
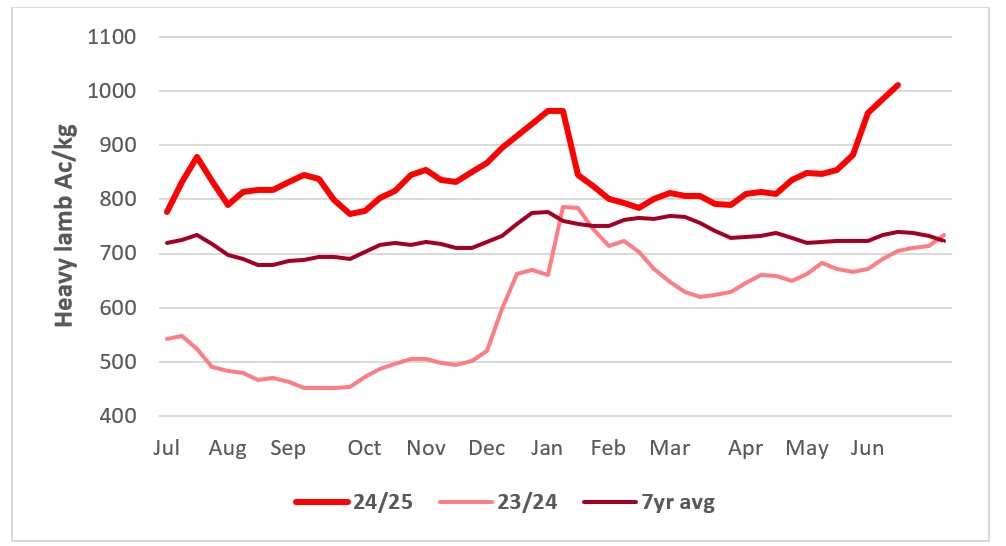 This chart shows the national saleyard indicators prices for heavy lambs this year vs 23/24 and 7-year average. Source: MLA
Don’t expect to see lamb in supermarket promotions this spring
Local trade operators have been forced to compete with exporters to obtain heavy trade lamb supplies as supplies start to tighten heading into winter. The lack of forage crops and tough spring and autumn seasonal conditions have seen lambs marketed sooner than normal. This has created a gap in supply before the arrival of new season lambs.
Supermarket lamb prices have not moved with the livestock price, indicating that supermarkets could be price averaging the meat shelf or using lamb as a loss-leader. The feedback from Elders agents suggest it’s unlikely that there will be an abundant supply of spring lambs that supermarkets regularly feature in their promotions. This could see promotions shift to other protein sources.
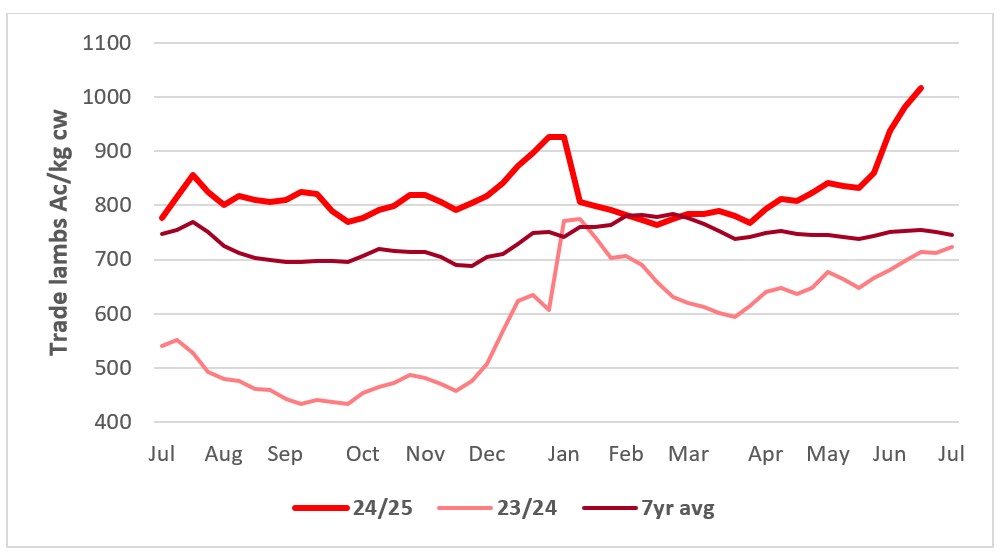 This chart shows the national saleyard indicators prices for trade lambs this year vs 23/24 and 7-year average. Source: MLA
Reduced New Zealand supplies could force China to import more Aussie lamb
With the New Zealand lamb supply season winding down, China could start to turn to increased imports of Australian lamb. They have already risen 12.5pc for the year, to help offset the decline witnessed across the Middle East (down 20pc YTD). Australia and New Zealand share the Chinese imported sheepmeat market and compete with the Chinese domestic flock, the largest in the world.
As land use changes in New Zealand, Australia has been increasing its share of the Chinese market. Like the Middle East market, it is sensitive to price.
Exports to the Middle East year to date have fallen by 20pc which is largely price driven.
Higher Chinese demand would be needed to sustain light lamb values at current levels. There’s talk that local lamb producers are likely to offload lambs at lighter weights, rather than risk the cost of supplementary feeding in the hope of heavy lamb premiums.
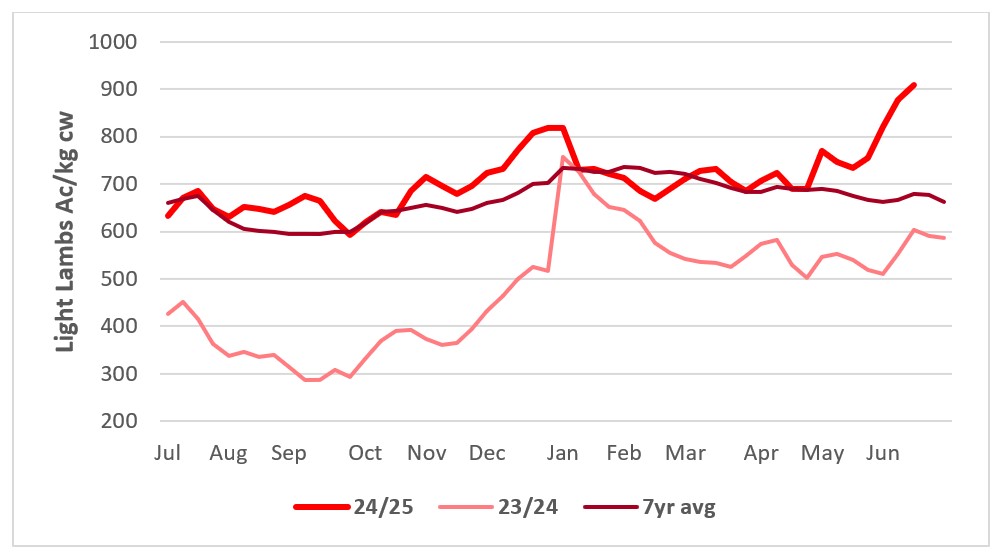 This chart shows the national saleyard indicators prices for light lambs this year vs 23/24 and 7year average. Source: MLA
Lambing feeding to support restockers
One of the positives from the past two difficult seasons has been the emergence of a dedicated lamb feedlot industry. Access to relatively cheap barley and store lambs has provided a strong feeding margin, and the development off on-farm infrastructure to support lamb feedlotting.
Having developed experience and working how it fits into the whole farm management program, some producers will now incorporate it into their businesses as a means of diversifying income streams, lifting productivity and adding value to grain and fodder.
Lamb feedlots should provide good competition on store lambs against restockers looking to rebuild flocks.
Expect to see good supplies of store lambs this spring, as many producers are unwilling to get caught feeding lambs again if the spring fails.
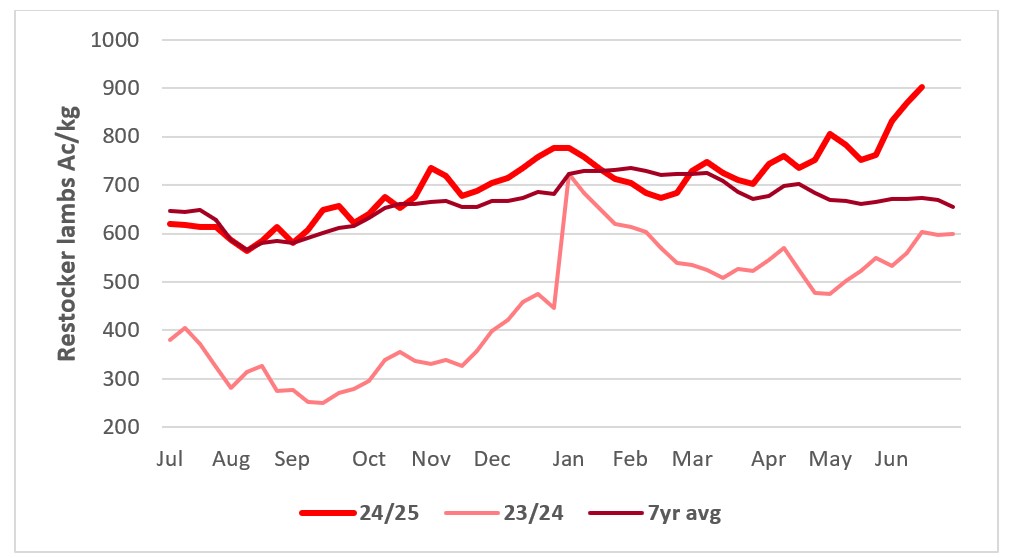 This chart shows the national saleyard indicators prices for restocker lambs this year vs 23/24 and 7-year average. Source: MLA.
Where’s the mutton?
With any run in the seasons, it’s difficult to see mutton supplies at anywhere near the levels of the last two years. Sheep flocks have been culled hard and are now very young, with only the best progeny retained.
The improved season in Western Australia, plus the hard cull over the past few years will mean that there will be far less WA sheep available to eastern states processors. Apart from some dry ewe culls after late autumn lambing, sheep supplies should dramatically tighten. Prices are currently close to reaching their historical resistance point at around $6 to 7/kg cw.
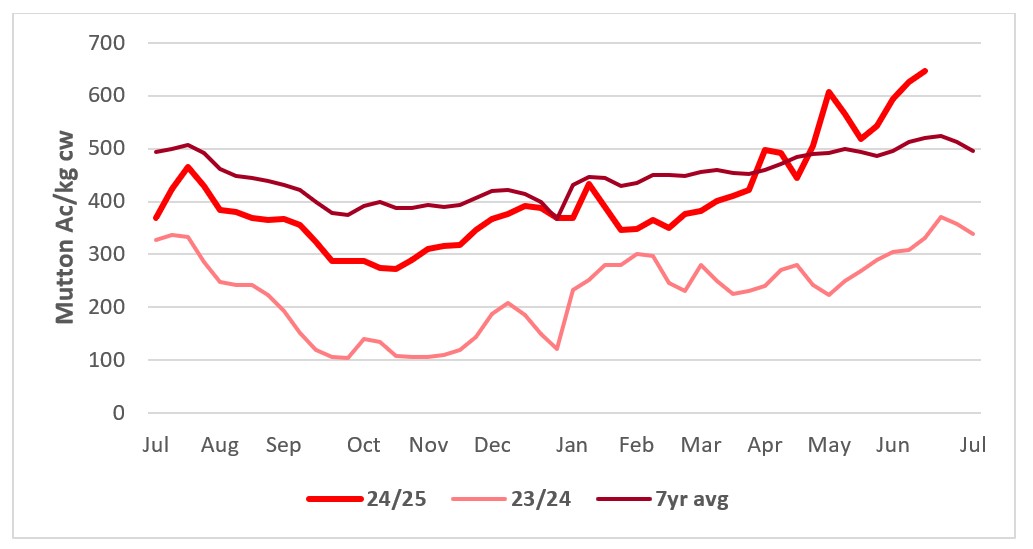 This chart shows the national saleyard indicators prices for mutton this year vs 23/24 and 7-year average. Source: MLA.
From the rails
Read what Elders livestock representatives from around Australia are saying about the markets in their regions.
“We have had a difficult year on lambs and are still trying to move the remaining old season lambs which will be gone by the end of June, early July. The poor weight gains on lambs was a combination of tough conditions when our ewes were mated last autumn, a tight spring that lambs were born into and then a very warm February which knocked our pasture and fodder crops around. Thankfully a mild autumn allowed them to recover and assisted in lambs eventually getting to trade/export slaughter weights. It is one of the few years that those who have struggled to put weight on lambs and have had to supplementary feed for a longer period have been rewarded.”
“On top of this, the very mild autumn has seen us battling with worms and flies with the first decent frost received in the last week.
“For this upcoming season a lower number of ewes were joined in better conditions and scanning rates have been around average 90 to 100pc. We are expecting solid marking and weaning rates given the strength of the season being enjoyed so far. But the first of our sucker lambs won’t be ready until very late in the year just prior to Christmas.
“There is talk that a local processor is cutting back working days due to the lack of stock available across the region.” - Mark Atkin, Branch Manager Guyra/Armidale.
“Ewe matings have been largely on a par with recent years despite a tight autumn in my area (east across to Orange and down to West Wyalong in the south-west). Even though the season has been patchy, ewes were joined in good condition with supplementary feeding for lambing February/April. Although lamb marking is just starting, indications are that lambing percentages will be normal at around 80 pc on the merino ewes and 120pc on the crossbreds.”
“Replacement ewe lambs were purchased a few months ago in anticipation of prices rising as the season improved and numbers tightened. The lack of Western Australian mutton has seen processors pay up for sheep which is providing competition for restockers.
“In the next few weeks lambs will go onto fodder crops with the top draft of suckers being ready late August/September with the balance of lambs either being fed on depending on the spring feed situation or sold as stores to feedlotters or as light lambs for the MK trade.
“Processors were too late in offering forward contracts to attract many takers and have exposed themselves to market forces of supply and demand with all the major export processor chasing lambs and competing with the local supermarket trade.” - Jake Lebrocque, Territory Sales Manager, Forbes.
“We are expecting less numbers and hopefully vendors are getting rewarded for their efforts feeding and hanging onto breeding numbers. I'm expecting the central-west and above into southern Queensland (as well as the western Riverina Hay-Ivanhoe) to be the significant supplier to the market of the first winter sucker lambs.”
“Welcome rain in the Riverina over the last month has improved the seasonal outlook and should allow the genuine late winter/spring lambers to improve on the results we are hearing currently.
“Processor reluctance to lift hook rates to reflect more recent saleyard pricing has agents pushing stock that are not already committed (and there is a portion that are committed) into the physical market. Of the lambs we are hooking off hard feed, the yields are decent. Some results surprising us with what some lambs are realising against in the yards (with cents/kg prices not as high as we have estimated due to higher yields).
“We are all looking for the resistance from processors so that we can determine where this peak of this market might be. Currently with maintenance planned and kills being reduced, we are yet to see that point of resistance like we did in winter and at Christmas last year, where prices escalated over a few weeks and processors stemmed prices very quickly.
“By the end of June, we will see the largest proportion of contracted stock move through the system. July is looking very exposed for the processor, as they were reluctant to offer winter contracts and have been behind saleyard values as prices began moving upwards.
“Some lambs have been secured in August pricing as the timing for selling at that point is significant for those who have been able to graze lambs on crops. - Henry Booth, Territory Sale Manager, Wagga.
“New sale record paid for lamb at Wagga today $425/hd so the market is red hot with processors realising that there is going to be a severe shortage of lambs this season. Estimates for the Riverina are that there were around 20pc less ewes mated with the tight spring forcing producers to offload breeding stock at the end of last year.”
“The early drop of March/April lambs will be the best but marking rates vary widely depending on the area and the operator (how well ewes were looked after) and could range from 80 to 150pc with conditions in the hills to the south-east of Cootamundra the worst affected. Even in areas where conditions were better, producers have been battling feral pests such as pigs out at Ivanhoe which are affecting lamb numbers.
“It’s unlikely that there will be any suckers available from the area before September with most producers failing to get a graze out of their dual-purpose crop because weak and late germination would not sustain any grazing pressure.
“Producers lambing now will have concerns about weaning rates as although lambing percentages could be ok, many ewes are in too poor condition to properly mother lambs with weaning rates likely to be significantly lower than normal with producers having run out of feed to maintain ewe condition.
“What happens in spring will depend on pasture conditions. A good spring may see producers opt to feed on and shear lambs and market later in the year. The other option being to sell as stores to feedlots or as light lambs to the MK trade.” - John Crawford, Branch Manager Cootamundra.
| NSW sheepmeat saleyard indicatorsc/kg dw | ||||
| 12 June 25 | +/- week | +/- month | +/- year | |
| Lambs | ||||
| Heavy | 1049 | 975 (+74) | 857 (+92) | 707 (+342) |
| Trade | 1076 | 986 (+90) | 829 (+247) | 730 (+346) |
| Light | 924 | 881 (+43) | 725 (+199) | 615 (+339) |
| Restocker | 955 | 910 (+45) | 743 (+212) | 640 (+315) |
| Merino | 930 | 880 (+50) | 734 (+196) | 630 (+300) |
| Mutton | 702 | 658 (+44) | 530 (+172) | 370 (+332) |
Source: MLA
“We have had a decent cull of our ewe flock over the past couple of seasons with very few 5-year-old ewes left in flocks, in some places we have even culled significant numbers of 3- and 4-year-old ewes. Overall joinings across the state this season would be down around 30pc.”
“Our spring joined ewes which lambed in April/May and are being marked now will be the best of them. Marking rates vary enormously depending on area and management and condition of ewes when joined but average lamb marking rates could be as low as 85pc with a wide variance from 50 to 120pc.
“We are expecting an even worse results from our autumn joined ewes with scanning rates well below what you would normally expect from premium lamb areas such as the western district. On top of this ewes are in too poor condition to properly mother lambs so weaning rates could be weak.
“Our first suckers will be available at the end of August but anything that doesn’t fit the grids by then will most likely to be sold as either stores to feedlots or as light lambs for the MK kill given the attractiveness of prices. Producers who shore lambs to feed on last season were not rewarded for the effort particularly as they had no help from the season. The last of our old season lambs are going out this week and they will bring a good result but those who sold earlier in the year weren’t rewarded for the effort to get them to trade and export weights.” - Nick Gray, State Livestock Manager Victoria/Riverina.
| Victorian sheepmeat saleyard indicators c/kg dw | ||||
| 12 June 25 | +/- week | +/- month | +/- year | |
| Lambs | ||||
| Heavy | 1055 | 979 (+76) | 836 (+121) | 717 (+338) |
| Trade | 1087 | 969 (+118) | 824 (+263) | 709 (+396) |
| Light | 1021 | 857 (+164) | 771 (+250) | 635 (+386) |
| Restocker | 1008 | 8828 (+180) | 831 (+177) | 659 (+349) |
| Merino | 971 | 796 (+175) | 674 (+297) | 545 (+426) |
| Mutton | 670 | 538 (-138) | 531 (+139) | 432 (+238) |
Source: MLA
“In relation to ewe lambs, throughout the mid-north, last year at least 25pc of the ewe lambs were hooked in winter, hence not being available in the spring off-shears sales. I would not be surprised if we had seen 30-50pc of ewe lambs (that would normally be offered as young ewes this spring) going to processors this past autumn/winter.”
“I would say that overall ewe lambing numbers would be back at least 20pc this year – year on year.
“It is a real mixed bag around South Australia with most agents focussed on selling the last of the old season’s lambs that have been on feed and looking to replace those with forward stores over the next few months. Some moderate rain falls have changed market sentiment and although its too late to promote much pasture growth, it should be enough to germinate crops and give the promise of some feed availability in early spring. Rain across southern NSW and Victoria has cooled the feed market a little and may convince growers with excess stock to let some go.
“Lambing percentages vary widely across the state depending on time of lambing and how ewes have been looked after. The best results are from March/April lambing through Burra, Clare and Mallee (Mildura) above 100pc but down to 30pc where growers have run out of feed to supplement ewes.
“Lambing across the Eyre Peninsula is happening now May/June with early indications that rates could be as low as 40 to 60pc in upper pastoral areas. Lambing rates will be slightly better on the west coast at 70 to 80pc where ewes have been fed.
“Uptake of forward contracts has been historically low, especially in the south-east due to a combination of market confidence, slow pasture growth (upper south-east) and expectation that store lamb demand will be quite high come spring.
“Those who lamb later may find a significant difference between the percentage marked and weaned with ewes struggling with a lack of feed and winter conditions in the south-east and lamb deaths noticeable in places with ewes not showing a lot of love for their lambs. Indications are that some processors may extend normal seasonal closures with Fletcher’s at Dubbo confirmed 20 June closure for three weeks.
“Processors have already expressed interest in purchasing light MK type lambs in August out of the paddock at weights between 16-24/kg with sales of $7.50/kg lwt (for new season lambs) on AuctionsPlus last week, providing an attractive option, particularly in there is another tight spring.
“Areas that have run out of feed (northern SA and pastoral areas) are facing difficult decisions about whether to hang on for a rain to get stock through to spring where prices for mutton and ewe lambs are expected to be strong or sell now while stock are still in saleable and prices reasonable. With some good rain in the south, some producers are willing to punt on store lambs and scanned in lamb ewes with this market improving significantly over the past month.” - Damien Webb, State Livestock Manager SA (North).
| SA sheepmeat saleyard indicators c/kg dw | ||||
| 12 June 25 | +/- week | +/- month | +/- year | |
| Lambs | ||||
| Heavy | 1024 | 964 (+60) | 782 (+240) | 696 (+328) |
| Trade | 954 | 910 (+44) | 848 (+106) | 676 (+278) |
| Light | 825 | 875 (-50) | 754 (+71) | 588 (+237) |
| Restocker | 864 | 934 (-70) | 770 (+94) | 503 (+361) |
| Merino | 812 | 775 (+37) | 754 (+54) | 628 (+184) |
| Mutton | 660 | 589 (+71) | 554 (+6) | 353 (+307) |
Source: MLA
“There was widespread rain last week, with finally some rain through northern and eastern areas up to 35mm. Central areas had less - up to 10mm and are seeking more falls to keep the season going. Northern areas normally supply the early suckers, and this is where the largest destocking has taken place so suckers will be slow with the main numbers coming October/November if the season continues.”
“Lambing is expected to be down 15pc across the board with maidens very low conception rates to normal with 80pc ewes scanned in lamb well back on normal seasons.
“Expecting 5 million lambs at best with merino ewe lambs likely to be retained. So, we may have 3.8 to 4 million lambs available for Processors /Live Ex /Feedlotters.
“There are forward contracts available out to mid-September from one processor at $8.80/kg cw but not a huge uptake as getting interstate interest already at better money with lamb pricing driven by eastern state processors. Two major processors are closing 20 June for annual maintenance with another major sheepmeat plant in SA closing from 4 to 25 July.
“With an expected shortage of mutton next season, I expect more competition for lambs as the flock in Western Australia is now so young.” - Wayne Peake, Livestock Manager Western Australia.
| WA sheepmeat saleyard indicators c/kg dw | ||||
| 12 June 25 | +/- week | +/- month | +/- year | |
| Lambs | ||||
| Heavy | 714 | 781(-67) | 658 (+56) | 440 (+274) |
| Trade | 779 | 787 (-8) | 660 (+117) | 544 (+235) |
| Light | 710 | 701 (+9) | 575 (+135) | 396 (+314) |
| Restocker | 706 | 686 (+20) | 577 (+139) | 428 (+278) |
| Merino | 695 | 705 (-10) | 526 (+169) | 274 (+421) |
| Mutton | 541 | 522 (+19) | 425 (+116) | 216 (+325) |
Source: MLA
“We’ve had clear days and no wind and no real frosts except in low lying areas. Our season has changed around with rain the past month with the south doing better than the north receiving 40 to 80mm while the north generally received 20 to 40mm. But the rain was enough to fill up some dams and provide some subsoil moisture for later even if it’s too late to promote much growth.”
“Ewe joinings are now finished with ewes mated in good condition. Producers have been through their flocks and offloaded a few culls the past month to take advantage of the lift in mutton prices. Ewe joinings may be a little lower than the last few years, but not substantially. The condition and availability of lambs will depend on spring, but the new season lambs won’t be available until later in the year and they won’t be the heavies with the main sucker turnoff season February/March.
“Currently we are wrapping up the tail of our old season lambs that are on grazing crops but numbers of dwindling fast and there won’t be too many left after the end of June early July. There’ll be another mutton cull after scanning in August, but sheepmeat supplies in Tassie will be very tight through until year’s end.” - Gavin Coombe, Livestock Manager Tasmania.
| TAS sheepmeat saleyard indicators c/kg dw | ||||
| 12 June 25 | +/- week | +/- month | +/- year | |
| Lambs | ||||
| Heavy | 935 | 957 (-22) | 788 (+147) | 703 (+232) |
| Trade | 984 | 1034 (-50) | 760 (+224) | 568 (+416) |
| Light | 924 | 932 (-8) | 792 (+132) | 431 (+493) |
| Restocker | 1139 | 790 (+349) | 784 (+355) | 297 (+842) |
| Mutton | 687 | 711 (-24) | 644 (+434) | 224 (+463) |
Source: MLA
Sources: Price data reproduced courtesy of Meat & Livestock Australia Limited.
*Disclaimer – important, please read:
The information contained in this article is given for general information purposes only, current at the time of first publication, and does not constitute professional advice. The article has been independently created by a human author using some degree of creativity through consultation with various third-party sources. Third party information has been sourced from means which Elders consider to be reliable. However, Elders has not independently verified the information and cannot guarantee its accuracy. Links or references to third party sources are provided for convenience only and do not constitute endorsement of material by third parties or any associated product or service offering. While Elders has exercised reasonable care, skill and diligence in preparation of this article, many factors including environmental/seasonal factors and market conditions can impact its accuracy and currency. The information should not be relied upon under any circumstances and, to the extent permitted by law, Elders disclaim liability for any loss or damage arising out of any reliance upon the information contained in this article. If you would like to speak to someone for tailored advice specific to your circumstances relating to any of the matters referred to in this article, please contact Elders.
