The latest insights and information on the Australian and global cropping markets as of May 2026*
Grain market landscape transforming rapidly
Global grain markets have strengthened since mid-February, after a subdued period following the southern hemisphere harvest as Argentina aggressively sold its record wheat crop.
The catalyst for the start of the rally was an extremely cold northern hemisphere winter that raised concerns about winterkill and saw speculative funds take profits and exit short positions. In March, the rally strengthened following the commencement of the Iran conflict as the investment community poured money into commodities as a hedge against inflation as oil prices spiked.
Over the past few weeks, the key driver has been mounting concerns about the US winter wheat crop that is rated only 31 per cent good to excellent (lowest rating since the 2023 drought). The hard red wheat areas (Nebraska, Kansas, Oklahoma, Texas) through the US Southern Plains particularly have been affected by persistent drought. This has more than offset forecasts for better crops in Europe and through the Middle East and North Africa (MENA).
Wheat markets are in transition to much tighter supplies as higher costs start to trim plantings and crimp yields. Recently the US Agricultural Attaché in Australia suggested that our 2026/27 wheat harvest could fall by 19 per cent to 29 million metric tonnes (mmt), as some growers without subsoil moisture choose not to plant given high costs of production, while others will shift plantings away from wheat to barley, legumes and canola.
Similarly, the USDA’s Attaché in Canada projected the country's 2026/27 wheat harvest at 36.2mmt, down about 10 per cent. This is due to plantings shifting away from wheat to soybeans in Manitoba, Ontario, and Quebec, and barley and canola in Saskatchewan and Alberta.
The impact of higher fertiliser costs on production will be most acutely felt by the northern hemisphere corn crop which is currently being planted. The next US corn crop may be the tipping point. The impact of supply chain issues comes to a head with a serious fall in plantings, yields and production with significantly higher prices required to ration consumption. Lower US corn production will underpin a general rise in the global grain values in the second half of 2026.
The prospect of a prolonged Middle East conflict and structurally higher oil prices is seeing a resurgence in demand for grain from the biofuel sector. This is very positive for the grain complex in the long-term. An executive for a major global grain trading company was recently quoted as saying “biofuel policies, not just in the US, but globally, are the most constructive they have ever been”.
As a result of the sharp rise in global energy prices since the Middle East conflict, some vegetable oils and biofuels are now trading at a discount to fossil fuels. This favours discretionary biofuel blending and renewed attention on increasing biofuel blending mandates, especially in countries with large agriculture sectors that can contribute to the fulfilment of domestic biofuel blending regulations.
- In the EU, rapeseed oil biodiesel is priced at a discount to gasoil for the first time in 15 years.
- US New York Harbour soybean oil biodiesel B99 regained a discount to heating oil after 14 months of pricing at a premium.
- Indonesian and Malaysian palm oil-gasoil spreads moved to historic lows incentivising higher blend requirements.
- In Brazil, competitive ethanol prices have kept gasoline prices almost 40 per cent lower than import parity and it is now considering increasing the ethanol blending rate in gasoline from 30 per cent to 32 per cent.
Ethanol’s significant price advantage in the US has promoted a nationwide allowance of E15 starting 1 May while ethanol’s advantage as an easily produced and versatile gasoline blend is encouraging governments worldwide to review their biofuel blending regulations.
The Middle East conflict will significantly alter the global grain balance sheet by slowing supply through the impact of higher costs of production and by boosting demand for grain for biofuels.
The grain bear market that commenced in mid-2022 is over and a new higher priced paradigm is about transform the global grain market landscape.
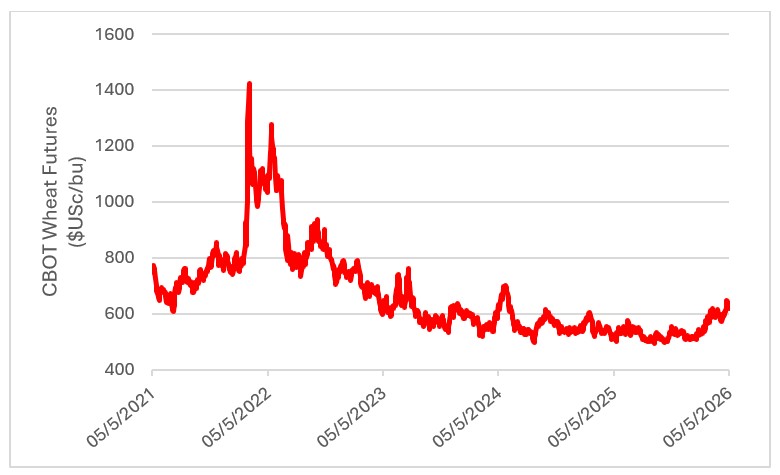 This chart shows US and French wheat and corn nearby futures price. Source: LSEG Workstation.
Drought the key driver in local wheat markets
While there has been some strengthening in wheat export quotes the main action in local markets has been driven by domestic feed grain users across New South Wales (NSW) and Queensland.
A severe drought in key supply areas of the northern feeding zone has halted grower selling and lifted prices from $350/tonne at the start of March to $440/tonne for wheat into Darling Downs feedlots. The Downs market is drawing grain from central NSW and the Riverina and away from southern markets.
Wheat has pushed from $325/tonne Griffith feedlot to $380/tonne, equal to delivered Melbourne quotes (normally Griffith prices against Melbourne less road freight into Melbourne end users) that have risen from $345/tonne at the start of March.
The Victorian track market is illiquid with grower selling likely to be restrained until production prospects firm. Southern grain is not working into export markets with trade stockholders looking to outturn grain for the domestic market. Traders with port and freight infrastructure are just ticking over, keeping deployed exporting some higher protein wheat.
Talk of imminent shipments of grain from South Australian ports into Brisbane seems to have helped flatten grain values across the northern zone. Soaring truck freight rates may prevent interstate grain moving from port onto the Downs. Growers trucking grain north into Downs feedlots and backloading with fertiliser is not common this year, with many not expecting to plant a crop. This is restricting liquidity across the northern feed zone. A good rain is needed to get grain moving again through the north.
Lower quality Western Australian (WA) wheat is working into the Philippines which is keeping some wheat exports moving. The Black Sea export pace is expected to halve over the next month from 4mmt to 2mmt, export demand for Australian wheat may pick up ahead of the northern hemisphere new crop in July. Demand from key importers in the Middle East continues to be subdued by complicated freight routes into the Middle East and high shipping costs.
Australia exported 2,109,423 tonnes of wheat in February, down 19 per cent from January. The Philippines at 385,852 tonnes, followed by Indonesia at 347,797 tonnes, and Iraq 166,555 tonnes were the three biggest customers, followed by Yemen on 161,929 tonnes. The Middle Eastern conflict is hindering exports with bulk shipments to Iraq, Kuwait and possibly Oman unlikely to be discharged in or near the Persian Gulf. Exports remain heavily skewed to WA and SA ports where wheat values are competitive into Southeast Asia.
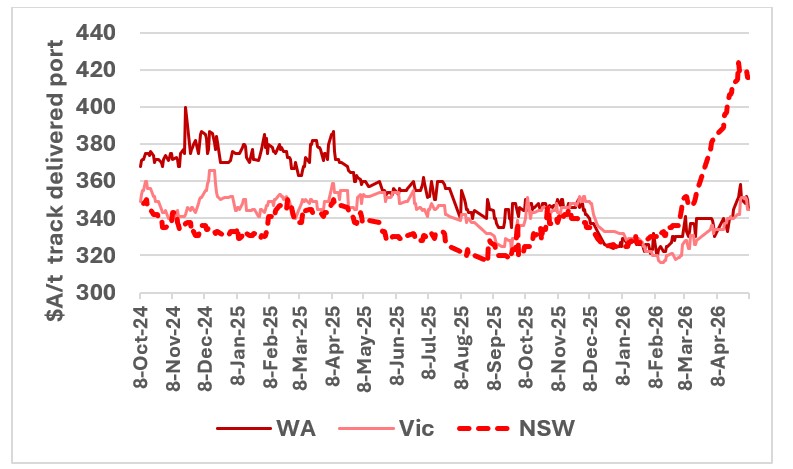 This chart shows wheat values at major Australian ports. Source: CGX.
Solid export and domestic barley demand drive prices to evens with wheat
In contrast to wheat, export demand for barley has been ripping along. In February 2026, Australia exported 1,509,584 tonnes of barley, up 11 per cent from January 2026, marking a consecutive record month for Australian barley exports. The strong export pace is expected to continue into mid-year with strong demand from China (80 per cent of exports) and limited competition for Australian barley until northern hemisphere new crop becomes available in July.
The barley shipping stem shows more than 80 per cent of expected annual shipments out to May. With more new business in the pipeline for May forward, it is expected that export volumes will surprise to the upside and lead to a complete clean-out of the available barley stocks in ports across key Australian export zones.
Chinese demand for Australian barley is a result of damage to its grain held in stock by widespread flooding across the North China Plain last October. Domestic Chinese corn values have risen 15 per cent over the same period. Australian barley values in WA/SA export zones should be well supported into mid-year. WA barley has firmed from $310 to $330/tonne free-in-store Kwinana post-harvest to be regularly trading for $355/tonne.
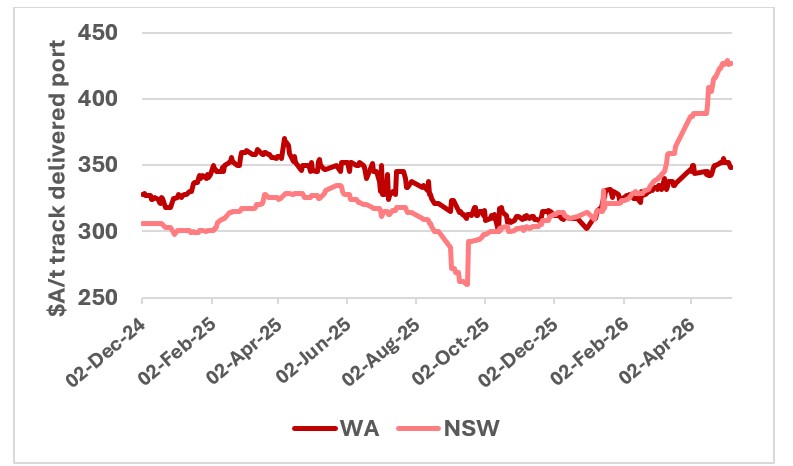 This chart shows the value of barley at ports in WA and NSW. Source: CGX.
In domestic east coast feeding zones, barley has led wheat values higher under the same influences of slow grower selling and solid end user demand. Barley is operating in a two-tier market across the east coast. There’s the usual feedlot demand but there’s also a drought feed market that is pushing bids (particularly ex farm values) higher while trade bids remain more measured and tied to wheat values.
Barley is $5 to $10/ tonne ahead of wheat in northern markets at $445/tonne Downs and $400/tonne Liverpool Plains, but $10/tonne below wheat in Griffith at $370/tonne and $20/tonne below wheat into Melbourne and Murray Bridge at $360/tonne and $340/tonne, respectively.
The relative strength of barley prices vs wheat and its lower fertiliser requirements are expected to encourage a 7 per cent lift in WA barley plantings to 2 million hectares at the expense of wheat. This is likely to be replicated through south-eastern Australian growing areas that have available soil moisture.
Chinese export demand keeps sorghum firm
Although China has recommenced imports of US sorghum, there has been solid interest in Australian sorghum for export to China, with February exports increasing to just shy of 200,000 tonnes.
Chinese interest in Australian sorghum is expected to continue as it looks to diversify its supply base away from the US. US sorghum exports so far this year have been around 3.6mmt.
Local sorghum values have lifted $5 to $10/tonne to $400/tonne delivered Brisbane/Newcastle or $375/tonne Downs and $360/tonne Liverpool Plains on buying demand from chicken and pig producers looking for cheaper alternatives to wheat/barley. Sorghum values should remain well supported with the domestic market now competing against export demand in the Brisbane and Newcastle port zone.
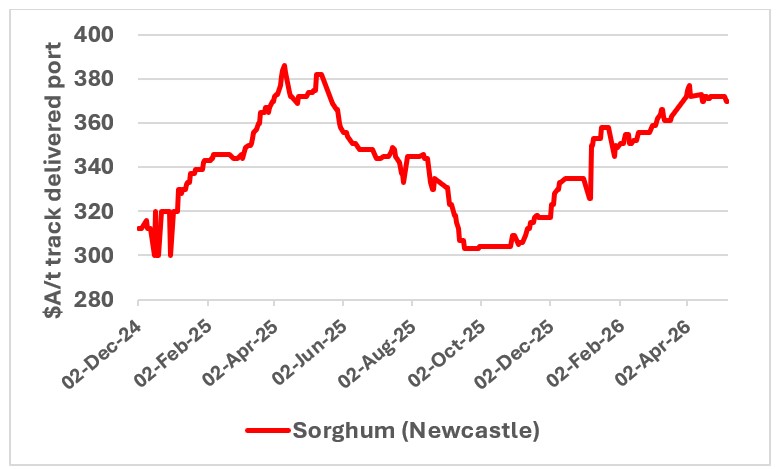 This chart shows the value of sorghum at Newcastle port. Source: CGX.
Most of the length in northern NSW/southern Queensland has moved from growers to the trade.
Poultry mills in the Greater Brisbane area have lifted the proportion of sorghum in their rations to full inclusion, or close to it, to reflect sorghum’s significant discount to white grains. The move has pulled back volume available to China ahead of the Central Queensland sorghum harvest expected to kick off late next month.
Central Queensland will harvest around 350,000 to 400,000 tonnes of sorghum with yields expected to be strong despite a tight finish and plenty of available soil moisture from the bumper wet season. Central Queensland growers are in a quandary with ex farm sorghum prices of $310 to 320/tonne (based on the export market) not stacking up against wheat bids of $380/tonne ex farm (from local feedlots). The difference is there is not a large pool of domestic sorghum users in Central Queensland and certainly not enough to absorb the crop. It would have to be trucked down to southern Queensland, the costs bringing it back to around current ex farm bids.
Canola rallies but veg oils lag crude and EU export demand remains subdued
Global canola values have rallied under the same influences as grains with higher oil prices and their associated impact on demand for vegetable oil for biodiesel blending. Since the start of the year, soy oil values have risen from 49USc/lb to 76USc/lb (up 55 per cent). This was driven largely by the Trump administration’s proposed biofuel mandates that would increase feedstock required for diesel blending requirements in 2027 by 60 per cent from 2025 levels.
Prices for oilseeds haven’t quite followed the same path as soy oil. Demand complicated by trade issues into China has affected demand for Canadian canola and US soybeans. Nonetheless Canadian canola values have moved from mid A$600’s/tonne to A$750/tonne (up15 per cent) and US soybeans from $550/tonne to $600/tonne (up 9 per cent).
The rise in Australian canola values has been even more subdued with values fluctuating depending on war sentiment between mid$700s/tonne to $800/tonne for non-GM canola. Australian canola is relatively attractively priced compared to other origins, however, with the trade having bought well at harvest and with shipping difficulties into the Middle East and subdued Chinese and European demand, interest in remaining local old crop stocks is subdued.
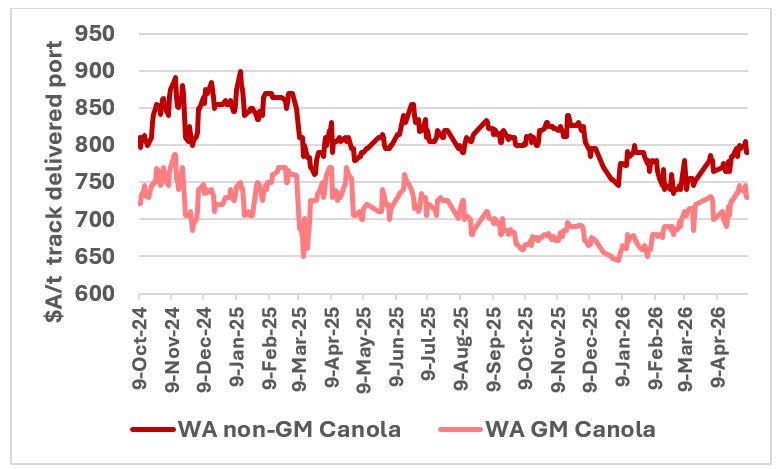 This chart shows the value of GM and non-GM canola at WA ports. Source: CGX.
Australia exported 883,243 tonnes of canola in February, up 55 per cent from the 569,938 tonnes shipped in January, and 68 per cent above the 524,845 tonnes shipped in February 2025 with Europe taking around 80 per cent of all exports.
Although imports are now picking up ahead of its next crop, a much large European rapeseed crop last year has reduced the EU’s need for rapeseed imports. For the 2025/26 marketing year so far, total EU rapeseed imports amounted to 3.85 million tonnes, a 40 per cent decline compared to last year. Canada’s share of EU imports has increased at the expense of Australia and the Ukraine.
So far in 2025/26 China has taken around 15 per cent of our exports, with the UAE and Japan other second-tier buyers. The UAE, which is a regular mid-tier buyer, has ceased purchases from March due to the closure of the Persian Gulf.
Canada placed total canola stocks at nearly 10 million tonnes as of 31 March, up from 7.84 million a year earlier. Planting on the Canadian Prairies remains behind pace due to below-normal temperatures, though warmer weather is expected by the weekend.
Record-high winter rapeseed sowings and sufficient soil moisture is expected to boost EU rapeseed production in 2026/27 to 20.97 million tonnes, up 0.4 million on last season and a new all-time high, according to Oil World (Germany).
Given expected production increases and large carry-in stocks in Canada and the EU, the maintenance of higher canola values will be dependent on increased demand from the biodiesel sector.
Drought feed demand and concerns over new crop support pulse trade
Grain brokers report that there has been an uptick in interest for chickpeas over the past fortnight. B ids rose to $650/tonne Goondiwindi or the equivalent of $680 to $690/tonne port. India has just harvested its rabi chickpea crop and buying interest could signal that yields were not as good as expected. Also, the Indian Government has been busy buying to replenish stocks which has caused some domestic shorts. Chickpeas are only currently levied at 10 per cent which is not prohibitive and supportive of imports.
The local Australian trade may keen to own stock with chickpea plantings across northern NSW and southern Queensland likely to be well back this year unless it rains soon. There is still about 800,000 to 900,000 tonne of regular demand from sub-continent outside India (Bangladesh, Pakistan, Sri Lanka, UAE) that needs to be satisfied.
In Central Queensland, growers are preparing to harvest a large mungbean crop of around 120,000 tonne that will be destined for China.
Faba beans are finding demand from graziers feeding livestock which is keeping this market firm in the absence of export demand from Egypt. Bids for beans have moved $40/tonne higher from $330 to $345/tonne post-harvest to around $370 to $380/tonne Moree/Narrabri.
Lentil demand from container packers for non-Indian sub-continent destinations is keeping this market ticking at the equivalent of $700/tonne southern port or $650/tonne up country packer.
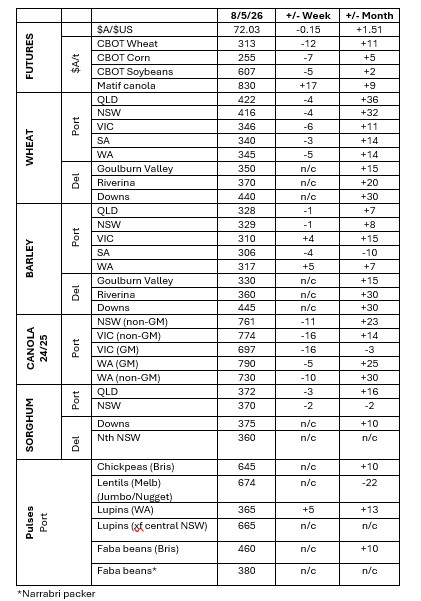 This table shows grower trade bids for grain in major Australian grain markets. Source: Clear Grain Exchange.
The information contained in this article is given for the purpose of providing general information only, and while Elders has exercised reasonable care, skill and diligence in its preparation, many factors (including environmental and seasonal) can impact its accuracy and currency. Accordingly, the information should not be relied upon under any circumstances and Elders assumes no liability for any loss consequently suffered. If you would like to speak to someone for tailored advice relating to any of the matters referred to in this article, please contact Elders.
Read previous reports
Cropping update - February 2026
Cropping update - October 2025
Cropping update - September 2025