Andrew Woods of Independent Commodity Services looks at Australian wool price drivers, explaining that Merino wool price cycles and trends tend to follow those of the wider apparel fibre markets.

Wool prices have been subject to plenty of heated debates over the decades, usually with more noise than substance. This article will look at the two main drivers of broad (20 to 22 micron) merino prices.
Demand
Getting a handle on demand for wool is tricky, as wool as an industrial fibre, meaning it is an input to a manufacturing process with demand along the supply chain (from a top maker to a spinner for example), as well as at the retail end. Measuring demand directly is impossible, so it is done using proxies. One such proxy is the wider apparel fibre market/s, including cotton, polyester, acrylics, the cellulosic fibres, cashmere and so on.
The graph opposite compares the average price for 20 to 22 micron wool sold at auction (all qualities included) to a weighted average price of cotton, polyester staple, acrylic and viscose (non-wool staple fibres or NWSF), from 1996 onwards in US dollar terms. US dollar terms are used as the Australian dollar can occasionally camouflage correlations. While the price levels vary between the two series, they tend to have common trends, peaks and troughs. The wider apparel fibre market is picking up similar demand signals to the merino market, causing them to wax and wane at similar times albeit at different price levels.
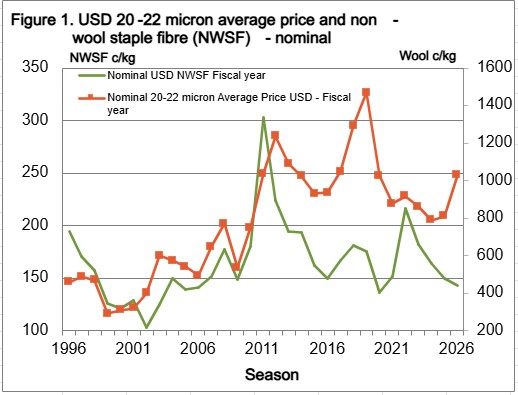 Graph showing the average price in US dollar of 20 to 22 micron wool and non-wool staple fibre for the seasons 1996 to 2026
Supply
On the opposite side to demand is supply. Supply, which is a combination of production and stocks, plays a big role in wool prices by affecting relative prices between wool prices and qualities as well as the relative price between wool and other fibres. The graph below compares the volume of 20 to 22 micron wool sold at auction by season from the mid-1990s, with an estimate for the current season, and the ratio of the average 20 to 22 micron price (shown in the graph above) to the NWSF (also shown above).
The simple story in the graph opposite is that as volume has decreased the price ratio has risen. Note the pandemic in 2020/2021 caused a big glitch in this trend. The international change in 20 to 22 micron wool has been similar to that seen in Australia. In the 1980s the rule of thumb for the Australian merino clip price ratio held that a ratio of 3 was fair value, with wool becoming expensive when the ratio rose above 3 and cheap when it fell below 3. The trend ratio of 21 micron is now around 7 to 8, with the higher ratio accounted for in the main by lower production.
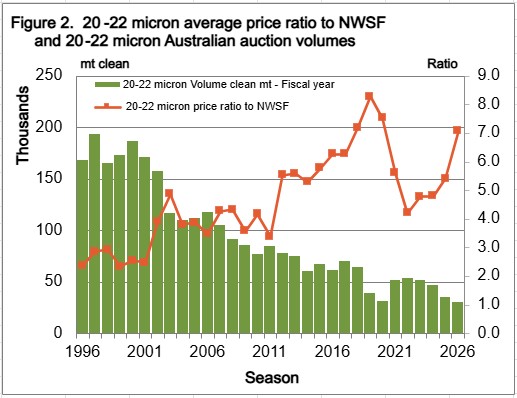 Graph showing the average price ratio of 20 to 22 micron wool to non-wool staple fibre and Australian auction volumes.
To show the impact lower supply pushing up the trend price ratio, if 20 to 22 micron production was still at early 1990 levels, and the price ratio was 3, the 21 MPG would be somewhere around 800 cents Australian.
By putting the NWSF and 20 to 22 micron supply together we can develop a simple model of the 20 to 22 micron price which explains two thirds of price during the past three decades. Figure 3 shows the 20 to 22 micron average price in US dollar terms along with a model price (using the NWSF and volume only). It does a reasonable job of indicating where fair value is given the two inputs, but there are periods when the actual price moves well away from the model such as in 2018, 2022-2024 and now. Interestingly the model indicates the average price for the 20 to 22 micron this season has returned to fair value.
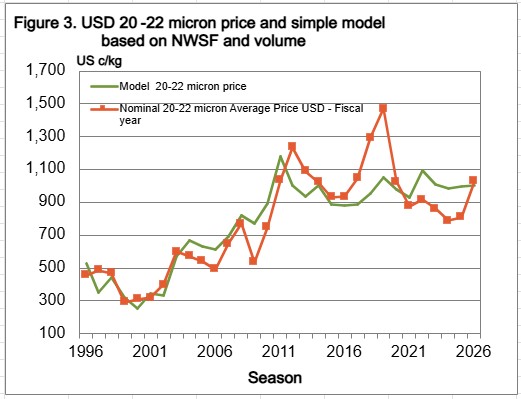 Graph showing simple model of 20 to 22 micron price in US dollar based on non-wool staple fibre and volume.
What does this mean?
There are many factors that will influence wool prices, but the Pareto principle (80/20 rule) holds, in that a few factors will provide most of the influence.
In the simple model shown in this article, non-wool staple fibre prices (reflecting the general demand for apparel fibres) and 20 to 22 micron supply (influencing price ratios) account for two thirds of the 20 to 22 micron price during the past three decades. Falling production of 20 to 22 micron wool continues to underpin a higher trend price ratio.
Disclaimer - important, please read:
Elders provides recommendations to the best of its knowledge and based on assumptions and information which it understands to be up to date, complete and accurate. If you are aware of any error or inaccuracy with the information on which this recommendation is based, you must immediately bring this to Elders’ attention. This recommendation is provided for your use only, and not that of any other third party. In some circumstances, the information Elders provided may be in summary form or derived from information sourced from third parties, however, Elders has not independently verified the information and cannot guarantee its accuracy.
You should always carefully evaluate all available information and consult Elders or another advisor further before you commit to any course of action or rely on any recommendation. Additionally, Elders expects that you will use your knowledge, experience and best judgement in relying on any recommendation and determining whether the recommendation is, and continues to be, appropriate. Elders do not accept liability or responsibility for any indirect, consequential or economic loss or damage of any kind arising from your acceptance or reliance on this recommendation. To the fullest extent permitted by law, all guarantees, warranties or implied terms and conditions are expressly excluded and Elders’ liability with respect to any services provided is limited to re-supply of the services, or the cost of having the services re-supplied. Elders may from time to time recommend products or services for which it may receive a financial incentive (rebate, commission, benefit, etc) from a supplier/manufacturer directly related to your purchase or use of that product or service.