Independent Analyst Andrew Woods, of Independent Commodity Services, reviews the Fremantle wool market through the Western Market Indicator, clarifying how indicator design and underlying clip quality drive differences in reported prices across Australia.
Key points:
- The average price of wool sold in Western Australia is higher than in the east primarily because of a higher Merino component.
- Much reduced discounts for low staple strength during the past three decades has also helped the price of Western Australian wool in relation to the east.
- The Australian Wool Exchange (AWEX) Regional Market Indicators reflect what is sold in a region/selling centre, where the quality varies between regions and so do the market indicators.
AWEX regional indicators1 and the Eastern Market Indicator are designed to reflect the average price level of wool sold at the different selling centres/regions. As the average quality of wool varies between centres/regions, the regional indicators will vary also. With this reporting, AWEXs provide transparency to the greasy wool market - one of the jewels of the industry.
In contrast, the Micron Price Guides (MPGs)2 have a constant quality and are designed to be compared like for like across the different regions. To quote AWEX, they are “intended to give an indicative price for a typical 12 month grown fleece type for each specific micron” and have an “identical structure for all three regions as to be directly comparable.”
To start looking at the Fremantle greasy wool market (wool is not scoured), the graph opposite compares the monthly average price for greasy wool sold in eastern and western selling centres in Australia, along with the difference (basis) between the two series. The eastern and western average prices follow the same trends and cycles, but the difference between them has changed with time.
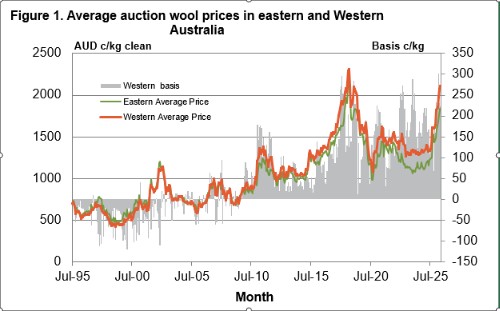 Chart showing the average auction wool prices in Eastern and Western Australia between July 1995 to July 2025. Source: AWEX
In the late 1990s the average price in Fremantle was around 40 cents per clean kg lower than the eastern average. There was plenty of variation around the average, nearly always a discount. Around 2010, the western discount began to turn into a premium, with the premium increasing through around 2019 before steadying, albeit with plenty of variation. Clearly there has been a structural change in the wool market to cause such a marked change in price relationship between Fremantle and eastern Australia wool markets.
To bring the AWEX Western Market Indicator (WMI) into the picture, the graph opposite compares the average Western Australian auction price (all in) and the AWEX Western Market Indicator. The AWEX WMI follows the average Fremantle price closely, with the average price being discounted by around 50 cents per clean kg up to 2015.
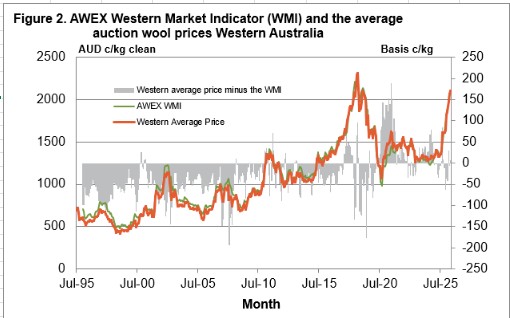 Chart showing AWEX Western Market Indicator and average wool prices in WA. Source; AWEX
From 2015 onwards the difference between the WMI and the auction average has jumped around (both positive and negative), with the WMI reflecting the average value of the Fremantle offering reasonably well.
Quality plays a large role in determining wool prices (think of 40 versus 12 micron). One of the key wool quality differences between eastern and Western Australia is staple strength. The graph opposite compares the eastern and western average staple strength by season from the mid-1990s onwards.
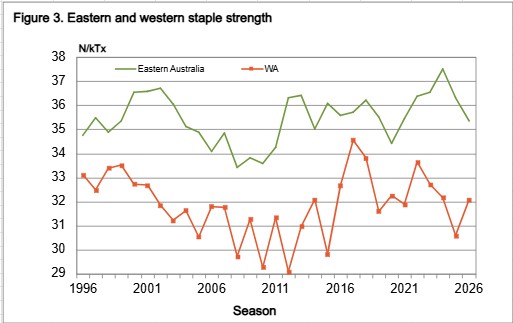 Graph showing the eastern and western staple strength between 1996 and 2026. Source: AWEX
Staple strength varies according to seasonal conditions in both regions, with the western strength being consistently lower. In the 1990s this was a big problem for Western Australian wool (and a lot of eastern clips as well) as the discounts for low staple strength were very large. The large discounts for low staple strength flowed into large discounts for short staple length as well which flowed onto discounts for pieces and bellies. The TEAM formulas on the AWTA website show staple strength and length are interchangeable, with conditions, when constructing a wool top blend – they are connected.
From 2003 onwards the discounts for low staple strength began to shrink, continuing to do so through to 2018-2020. The graph shows a discount series for low staple strength, full length 19 micron fleece to the eastern 19 MPG from 1996 to the current season, in both cents per kg and percentage terms. The discount shrank from 20 to 25 per cent (pc) in the late 1990s to around 3 to 4 pc. That is a change in discount from being punitive to being easily lost in the weekly to and fro of prices paid at auction.
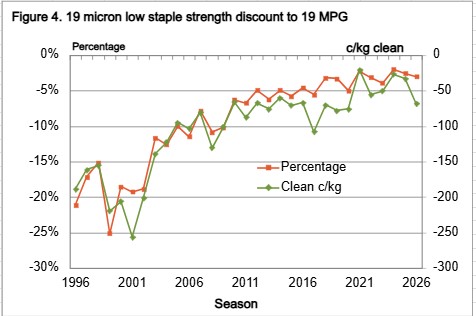 Graph showing the 19micron low staple strength discount from 1996 to 2026. Source: AWEX.
For Western Australian wool, with its lower staple strength, this was a boon.
Wool quality has many faces, another of which is breed. The graph opposite shows the proportion of Merino wool sold at auction in the east and west. The proportion is now 20 pc lower in the east, 74 pc versus 94 pc in Fremantle. The proportion of Merino wool in the eastern clip has returned to levels more normal in the 1960s, while the western Merino proportion remains high.
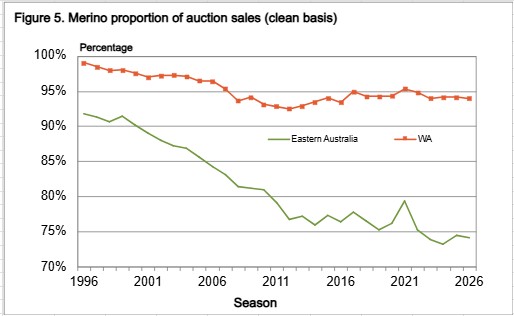 Graph showing the merino proportion of auction sales between 1996 and 2026. Source: AWEX.
To demonstrate how this will influence the average price for eastern and Western Australia, the graph opposite shows the average crossbred price discount to the average merino price in Australia for the past three decades in both cents per kg and percentage terms. During the past decade the crossbred discount has been around 1000 cents (800 to 1170 cents), with the percentage discount ranging between 50 and 74 pc.
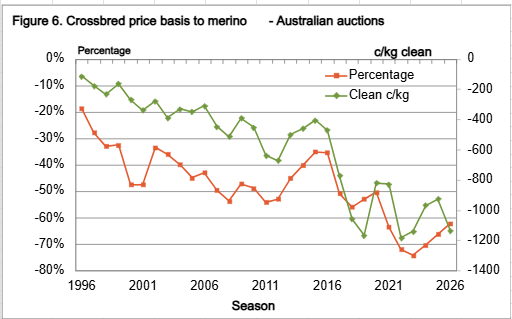 Graph showing the Crossbred wool price basis compared to Merino between 1996 and 2026. Source: AWEX.
For Fremantle, where the wool sold has 20 pc more merino, the average price will pick up 200 cents compared to the east (20 pc of 1000 cents). Look at the first graph again, and this simple calculation explains the bulk of the premium the western average price has over the eastern average price during the past decade.
To summarise, a combination of much reduced staple strength discounts and much higher proportion of merino wool has lifted the average Western Australian wool price from a discount (around 50 cents clean) to the eastern average price to a substantial premium (in the order of 200 cents clean) over the past 30 years.
What does this mean?
The AWEX regional indicators are designed to reflect the average value of wool sold in the three regions/selling centres – whatever quality wool is sold there, unlike the MPGs which have identical structures and are designed to provide a price comparison across regions for the same quality. Due to the small crossbred component of the Western Australian wool clip, the WMI is always higher (by a substantial margin) than the Southern Market Indicator and usually higher than the Northern Market Indicator (not so for most of 2021-2022).
Disclaimer - important, please read:
Elders provides recommendations to the best of its knowledge and based on assumptions and information which it understands to be up to date, complete and accurate. If you are aware of any error or inaccuracy with the information on which this recommendation is based, you must immediately bring this to Elders’ attention. This recommendation is provided for your use only, and not that of any other third party. In some circumstances, the information Elders provided may be in summary form or derived from information sourced from third parties, however, Elders has not independently verified the information and cannot guarantee its accuracy.
You should always carefully evaluate all available information and consult Elders or another advisor further before you commit to any course of action or rely on any recommendation. Additionally, Elders expects that you will use your knowledge, experience and best judgement in relying on any recommendation and determining whether the recommendation is, and continues to be, appropriate. Elders do not accept liability or responsibility for any indirect, consequential or economic loss or damage of any kind arising from your acceptance or reliance on this recommendation. To the fullest extent permitted by law, all guarantees, warranties or implied terms and conditions are expressly excluded and Elders’ liability with respect to any services provided is limited to re-supply of the services, or the cost of having the services re-supplied. Elders may from time to time recommend products or services for which it may receive a financial incentive (rebate, commission, benefit, etc) from a supplier/manufacturer directly related to your purchase or use of that product or service.