Following a recent trip independent analysist Andrew Woods of Independent Commodity Services, compares the South African wool industry to the Australian industry and shares his thoughts.
Key points:
Merino wool is predominantly supplied by southern hemisphere countries, which includes South Africa. The South African wool industry has some facets very much like the Australian industry and some completely different aspects.
South Africa is the other southern hemisphere country which has a good reporting system for their wool auction system, where nearly all wool is sold - as is the case for Australia. Arguably South Africa has a better reporting system as Cape Wools regularly publishes annual supply data, something Australia does not. It also publishes weekly quotes for RWS premiums.
Growers often consider South African wool production as competition for Australian production, which is valid if we are planning to further shrink our clip in order to boost price. In the long run that is a losing strategy.
A more constructive approach is to view South African wool production as a sibling to Australian production, with all the competition and co-operation which goes on between siblings.
This article outlines some of the basic facts about the South African Merino clip (which makes up around 70 pc of their total clip on a greasy basis, similar to Australia), rounding the commentary out with some insights the writer gained visiting these parts of this region during the recess.
Note: The insights are limited, as we only travelled from Gqeberha – formerly known as Port Elizabeth or PE to the locals (the centre of the wool industry in terms of wool sales and where Cape Wools is based) via the high Karoo, back to the coastal region then on to Cape Town. This is the equivalent of driving through the western Riverina, down through western Victoria across to Melbourne. For anyone considering such a trip, it is well worthwhile as that part of South Africa is stunningly beautiful.
Volume wise, the South African Merino clip has traditionally been around 10 to 12 pc of the Australian clip in greasy terms (around 10 pc in clean terms as the average Australian yield is 2 pc higher). This is shown in the graph opposite. With the drop in recent season of the Australian Merino volume, the proportion has increased to around 13 to 14 pc.
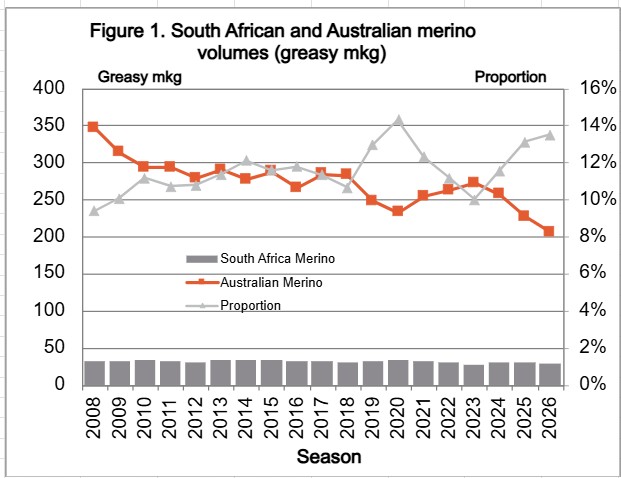 Graph showing South African and Australian Merino volumes. Source: Indepenent Community Services.
South African wool production has faced similar pressures to Australia from cropping, making their rangelands wool production more important. Labour costs are cheap, which is one of the key differences to the Australian industry, with shearing quoted generally around $1.50 per head (full contract), ranging from 80 cents (you get what you pay for) up to $3.00 in the more remote regions. The main staple length of the South African Merino clip is around 60 mm as many farmers are shearing on six to eight month intervals.
The volumes used in this comparison are auction based. Around 10 pc of the South African clip is aggregated in the homelands from communal farmers, and exported directly by a couple of exporters. There are some 40,000 communal farmers registered with Cape Wools (typically with less than 10 sheep) compared to around 8,000 commercial farmers whose wool as a rule is sold at auction.
Micron wise, the South African Merino clip has followed a similar trend to the Australian clip, remaining 0.5 to 0.7 micron broader at around 19.2 micron. Figure 2 shows the annual Merino fibre diameter for South Africa and Australia from 2008 to last season.
South African farmers wonder how Australian farmers cope with $11 to $12 per head shearing costs.
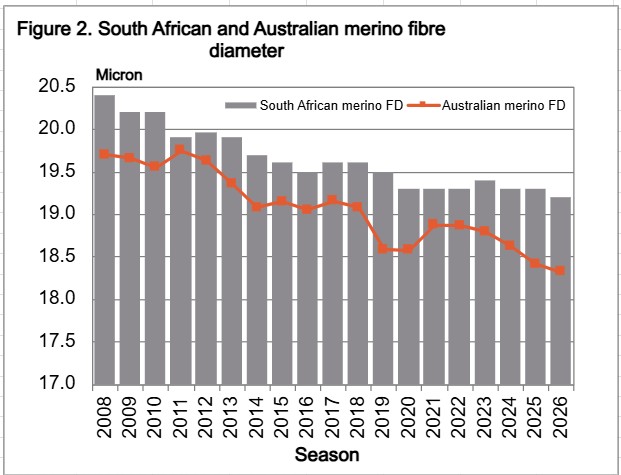 Graph showing South African and Australian Merino fibre diameter. Source: Indepenent Community Services.
They tend, like many Australian farmers, to think in terms of gross margins and a fixed stocking rate, which does not allow improved pasture productivity to reduce overhead costs per animal.
In addition, their general view (again similar to Australia) is that gains from reducing micron are outweighed by losses in clean fleece weight chops off another potential productivity gain in terms of wool quality. Averages are useful but they can hide some interesting information.
The graph opposite shows the South African Merino clip (greasy terms) as a proportion of the Australian clip for last season by micron category. The broader nature of the South African clip means that it has a higher volume ratio to Australia for the broader Merino micron categories, around 25 pc or more for 20.5 to 23.5 micron. So, for the broader Merino micron categories it is a meaningful supplier to the international wool supply chain.
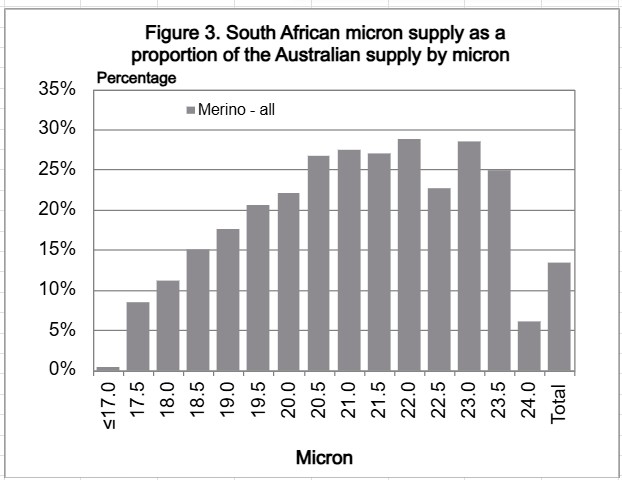 Graph showing South African micron supply as a proportion of the Australian supply by micron. Source: Indepenent Community Services.
When non-wool attributes are added, South African Merino wool really starts to punch above its weight. Fly strike is not an issue there, so mulesing is not carried out.
The graph opposite (running to 22 micron) shows South African Merino volumes compared to Australian non-mulesed Merino wool and also for RWS accredited wool. For the RWS comparison it is assumed half of the South African Merino clip is accredited (this is one area where Cape Wools has yet to refine their annual data).
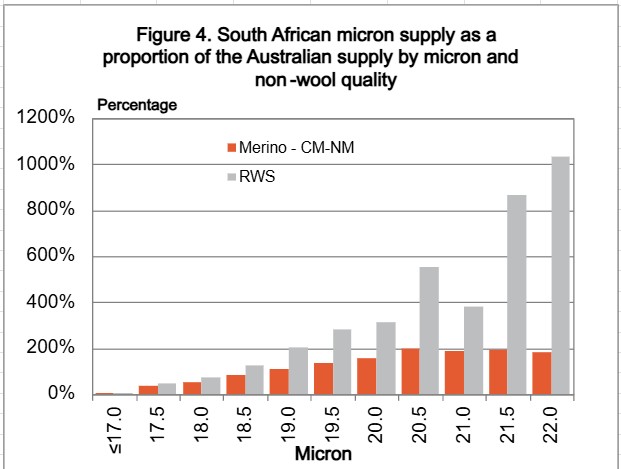 Graph showing South African micron supply as a proportion of the Australian supply by micron and non-wool quality. Source: Indepenent Community Services.
Compared to non-mulesed Australian Merino volumes, South Africa is equivalent for 18.5 and 19 micron and then exceeds Australian volumes by a factor of two for the broader micron categories. When it comes to 18.5 micron and broader Responsible Wool Standard (RWS) accredited Merino wool, South Africa dominates. From a marketing perspective, driven at the farm level, the South African Merino clip has parlayed a lack of mulesing into a significant financial advantage by having around half of the Merino clip accredited to RWS.
Cape Wools is the marketing arm of the South African wool industry, employing 4 to 5 people. It provides market reporting, some marketing initiatives and runs their traceability program which has immediate importance for disease control (foot and mouth disease) and in the longer run for quality systems wanting to follow wool back to the farm level.
In simple volume terms, the Australian Merino clip is seven to ten times the size of the South African Merino clip (depending on the comparison used). However, processors buy on wool specifications and quality, and when these filters are applied to the Australian Merino clip, South Africa more than matches us on the broader side of our Merino production. Commercial wool growers in South Africa face many of the issues Australian farmers also face, with on farm productivity a key common problem.
In summary, the South African wool industry (the commercial farmer section) is similar to Australia except it has cheap labour and ongoing disease issues. All wool exported (nearly the entire clip) is heat treated (farm bales held in store for 28 days at 18 degrees) beforehand due to the presence of foot and mouth disease. The other part of the South African wool industry, the communal farmers, is minor in terms of volume and different altogether, averaging less than ten sheep per farmer.
Disclaimer - important, please read:
Elders provides recommendations to the best of its knowledge and based on assumptions and information which it understands to be up to date, complete and accurate. If you are aware of any error or inaccuracy with the information on which this recommendation is based, you must immediately bring this to Elders’ attention. This recommendation is provided for your use only, and not that of any other third party. In some circumstances, the information Elders provided may be in summary form or derived from information sourced from third parties, however, Elders has not independently verified the information and cannot guarantee its accuracy.
You should always carefully evaluate all available information and consult Elders or another advisor further before you commit to any course of action or rely on any recommendation. Additionally, Elders expects that you will use your knowledge, experience and best judgement in relying on any recommendation and determining whether the recommendation is, and continues to be, appropriate. Elders do not accept liability or responsibility for any indirect, consequential or economic loss or damage of any kind arising from your acceptance or reliance on this recommendation. To the fullest extent permitted by law, all guarantees, warranties or implied terms and conditions are expressly excluded and Elders’ liability with respect to any services provided is limited to re-supply of the services, or the cost of having the services re-supplied. Elders may from time to time recommend products or services for which it may receive a financial incentive (rebate, commission, benefit, etc) from a supplier/manufacturer directly related to your purchase or use of that product or service.