Independent analyst Andrew Woods of Independent Commodity Services explains that very fine Merino prices remain strong amid record supply.
Key points:
- Price cycles for merino wool tend to double (rise by 100 per cent) from trough to peak.
- On the downside the standard downturn is a 30 to 40 per cent (pc) fall in price (peak to trough).
- As a grower it is unlikely you will catch all of the upside (think of how many people you know who sold at the peak in 1951 or 1973 – not many) or downside.
- These rules of thumb are applicable to other commodities.
Using monthly average prices, the average Merino micron (around 18.2 micron) MPG is up by 35 pc on June 2025 levels and up 54 pc on August 2025 levels (the low point of the recent cycle). In this article we will look at what patterns there have been in the past for Merino prices movements up from cyclical lows (trough to peak) and down from cyclical highs (peak to trough).
Cyclical price peaks and troughs are seen in hindsight. In this sense a cyclical peak or trough in price is taken as an extreme across a five-year period with five years a subjectively chosen period of time. Once past an extreme, hindsight starts to kick in and if an assessment that a cyclical price has been passed history can be used as a rough average guide as what to expect in terms of future price targets and time.
Trough to peak cycles
The graph opposite shows the average merino micron MPG in nominal Australian dollar terms from 1980 to January 2025. Nominal terms are used as we want to look at the change in price as it was at the time. Below the merino price series is the variation in monthly average price to the lowest price of the preceding five years. This schematic is looking at trough to peak movements, so the price change is positive. The two standout price cycles are 1988 and 2002 where price lifted by around 160 pc from the low of the previous five years.
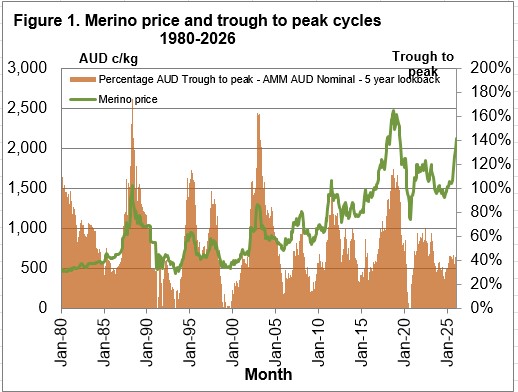 Graph showing merino prices and the trough to peak cycles for the period 1980 to 2025.
As a general rule a standard price cycle should see the price rise by 100 pc or so (double).
The big cycle in 2011, driven by a rampant cotton market, missed the 100 pc rise as the Australian dollar was above parity with the US dollar at the time. The current rise in the market, up by 54 pc on the low prices reached in spring 2024, from the perspective of a trough to peak cycle the current market rise is a small one. To reach a standard cycle rise of 100 pc this time around requires the current merino price to rise by another 29 pc (around 600 cents).
Peak to trough cycles
The other side of the cycle, the peak to trough fall, is illustrated opposite. It shows the same merino price series as above, with the bars show the price movement of each from the highest price of the preceding five years. The peak to trough movement is negative (occasionally zero).
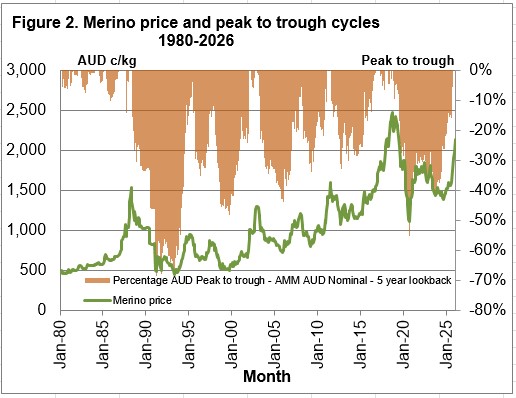 Graph showing Merino prices and their peak to trough cycles from 1980 to 2025.
The general rule for a standard downturn is a fall of 30 to 40 pc from the peak price.
In late 2019, the market looked to be set for a mild 30 pc fall from the 2018-19 peak price, until the pandemic tacked another separate 30 pc drop onto the market turning it into a severe downturn. The collapse of the RPS in 1991 was behind the big down cycle of recent decades.
These calculations use the extreme prices (highs and lows) which most sellers will not experience. The range in prices discussed above need to be moderated slightly for application to individuals. As a rough guide the volatility or range in price for an individual woolclip is likely to be around 70 pc of the ranges mentioned. For example, if a cyclical low is determined, and a projection of double that price is then made assume you might be able to sell at 70 pc above the cyclical low.
What does this mean?
The trough to peak and peak to trough analysis is useful as a rough guide to the likely price variation when looking forward two three years. Forwards and futures have no price forecasting ability, beyond their price curves telling us whether the market is optimistic or pessimistic so having a this rule of thumb, based on history, can be useful. It is more useful than using the naïve forecast that there will be no change in price.
Disclaimer - important, please read:
Elders provides recommendations to the best of its knowledge and based on assumptions and information which it understands to be up to date, complete and accurate. If you are aware of any error or inaccuracy with the information on which this recommendation is based, you must immediately bring this to Elders’ attention. This recommendation is provided for your use only, and not that of any other third party. In some circumstances, the information Elders provided may be in summary form or derived from information sourced from third parties, however, Elders has not independently verified the information and cannot guarantee its accuracy.
You should always carefully evaluate all available information and consult Elders or another advisor further before you commit to any course of action or rely on any recommendation. Additionally, Elders expects that you will use your knowledge, experience and best judgement in relying on any recommendation and determining whether the recommendation is, and continues to be, appropriate. Elders do not accept liability or responsibility for any indirect, consequential or economic loss or damage of any kind arising from your acceptance or reliance on this recommendation. To the fullest extent permitted by law, all guarantees, warranties or implied terms and conditions are expressly excluded and Elders’ liability with respect to any services provided is limited to re-supply of the services, or the cost of having the services re-supplied. Elders may from time to time recommend products or services for which it may receive a financial incentive (rebate, commission, benefit, etc) from a supplier/manufacturer directly related to your purchase or use of that product or service.