Independent analyst Andrew Woods of Independent Commodity Services takes a look at the Western Australian wool industry.
Key points:
- Wool production in Western Australia is following similar trends to eastern Australia in terms of volume and Merino fibre diameter.
- Sheep and lamb disposals have been at high levels relative to the flock size in recent years consistent with the view that the flock has shrunk substantially since 2022.
- Price discounts for Western Australian wool have shrunk negligible levels since the 1990s, even as the clip has become much finer where discounts have historically been higher.
The Western Australian sheep flock has shrunk in recent seasons, after being stable for the best part of a decade, and as a consequence so has wool production. As the industry waits for official estimates of the flock number (the Australian Bureau of Statistics is struggling to develop a new method of assessment given the problems with traditional surveys), we can take a look at changes in wool production in relation to the eastern clip.
Livestock products such as wool and slaughter numbers/meat production provide timely and accurate views of livestock output in Australia but they do not show the underlying flock or herd structure, which is the productive engine driving livestock output. A simple example of where livestock numbers are useful is the ratio of adult sheep slaughtered to the flock size which is a good barometer of whether the flock is expanding or contracting. The MLA uses a similar measure, the stock turn-off ratio, to help understand if the Australia cattle herd is contracting or expanding.
 This chart shows Western and Eastern Australian wool production. Source: AWTA
Figure 1 compares the eastern and Western Australian wool clip size (AWTA farm bales) from the late 1990s onwards. Current season volumes use data to October which are then are adjusted pro rata to estimate the full 2025-26 season. The western volume is shown on the left hand axis and the eastern on the right hand axis. The downward trend is common between the two regions with Western Australian volume down 70 per cent (pc) (from a base of 1998-2002) and the eastern volume down 56 pc. Since 2022-23 western volumes are down 35 pc and eastern volumes 21 pc. It is this recent fall in production where current flock size data would help us understand better what is going on.
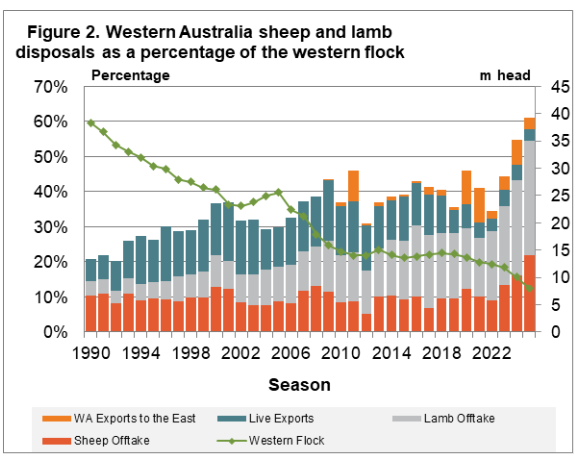 This chart shows Western Australian sheep and lamb disposals as a percentage of the western flock.
So we know sheep numbers are down from the lower wool production, and high offtake rates. What about flock makeup, breed composition? Figure 3 shows the proportion of Merino wool in Fremantle sales by season and in eastern states from the late 1990s. In the east the proportion of Merino wool has fallen from above 90 pc to around 75 pc, with a recent jump. In Western Australia the proportion is steady around 95 pc. In terms of wool sheep there does not seem to be a great change happening in Western Australia.
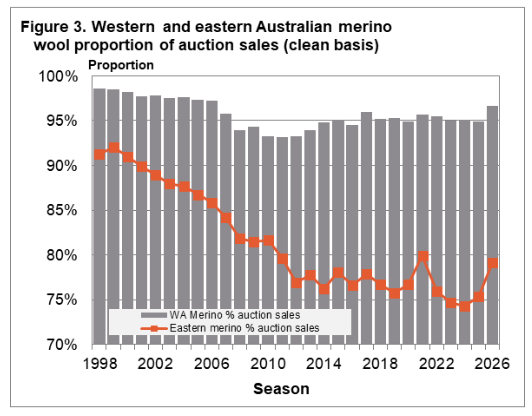 This chart shows Western and Eastern Australian Merino wool proportion of auction sales.
In the absence of official flock numbers, estimates have been used for recent years to show how the proportion of sheep sold off farm (to abattoirs, live exports and eastern states) in Western Australia has risen markedly in recent seasons to 2024-25, in Figure 2. The number of adult sheep, lambs, live exports and sheep shipped to the eastern states is expressed as a percentage of the starting flock size for each season. In the period 2007 to 2023 the entire offtake oscillated around 38 to 40 pc before rising to 55 pc in 2023-24 and 61 pc in 2024-25. Even allowing for error in the recent flock estimates the offtake has been flagging a major reduction in the flock size and/or a rearrangement in the structure of the flock.
Merino wool quality, driven primarily by fibre diameter, is changing. Figure 4 shows the season averages for Merino fibre diameter (auction data) in east and Western Australia from the late 1990s. The western Merino micron has tended to lag behind the eastern micron, although this difference has closed up in recent seasons. A prime example of this change in the western clip is AWEX quoting 16.5 to 17.5 MPGs quite regularly for Fremantle sales this season.
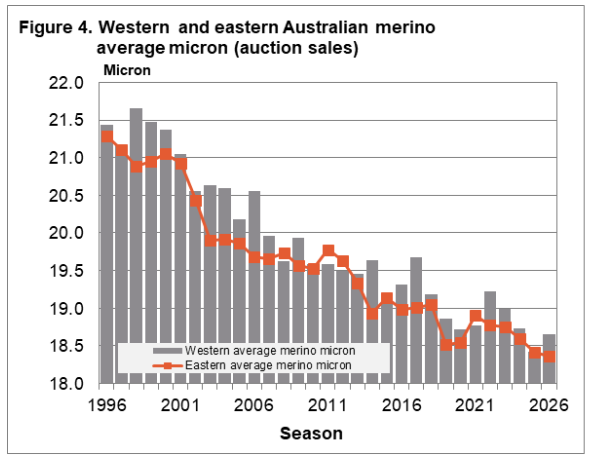 This chart Western and eastern Australia Merino average micron, based on auction data.
The staple strength of the WA Merino clip tends to be around 4 N/ktx weaker (32 versus 36) than the eastern clip, although this does vary season to season especially in the big swings associated with going into and coming out of drought. Figure 5 shows the annual discounts for western 30 N/ktx full length Merino fleece to the east, for 17, 19 and 21 micron from the late 1990s. In the 1990s Fremantle discounts were substantial for 17 and 19 micron. These discounts shrank through the 2010s and then steadied at small levels. Now it is quite possible to get WA wool quoted above eastern prices in some weeks.
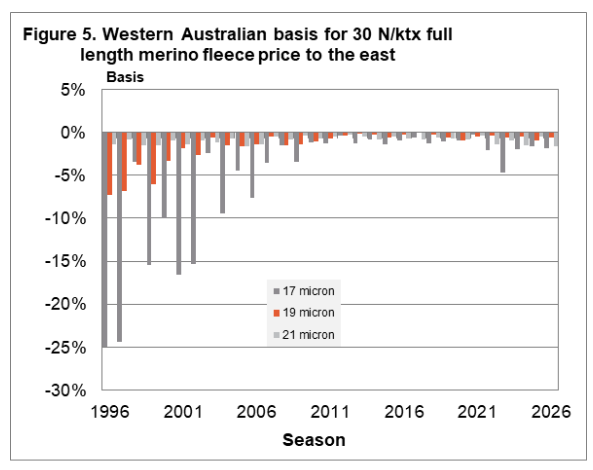 This chart Western Australian basis for 30N/ktx full length Merino fleece price to the East.
What does this mean?
In many respects the Western Australian sheep flock is following similar trends seen in eastern Australia, New Zealand and South America. The degree of change may vary but the trend is common across the different sheep regions. In terms of wool quality the western Merino clip has been moving in line with the eastern clip, with the average fibre diameter falling (seasonal variations year to year aside). The good news here is the effective disappearance of the punitive discounts for western fine Merino wool which were present in the 1990s. In terms of Merino wool the western clip has maintained a high proportion, around 95 pc, to date.
Disclaimer - important, please read:
The information contained in this article is given for general information purposes only, current at the time of first publication, and does not constitute professional advice. The article has been independently created by a human author using some degree of creativity through consultation with various third-party sources. Third party information has been sourced from means which Elders consider to be reliable. However, Elders has not independently verified the information and cannot guarantee its accuracy. Links or references to third party sources are provided for convenience only and do not constitute endorsement of material by third parties or any associated product or service offering. While Elders has exercised reasonable care, skill and diligence in preparation of this article, many factors including environmental/seasonal factors and market conditions can impact its accuracy and currency. The information should not be relied upon under any circumstances and, to the extent permitted by law, Elders disclaim liability for any loss or damage arising out of any reliance upon the information contained in this article. If you would like to speak to someone for tailored advice specific to your circumstances relating to any of the matters referred to in this article, please contact Elders.