The latest on the Australian wool market Week Four, Season 2026/27, direct from the Elders wool team.

The Australian wool market has suffered falls this week, with all sectors recording losses.
Fremantle returned to the roster, pushing the national total up to 31,751 bales. This was 10,521 more than the previous week. The overall falls were driven by losses in the Merino fleece sector.
On the first day, the Micron Price Guides (MPGs) for Merino fleece dropped by between 12 and 50 cents. Only the 19.5 and 20.0 micron MPGs in the north resisting the losses and were unchanged.
On the second day, the MPG movements for Merino fleece ranged between plus 15 and minus 33 cents. The benchmark Eastern Market Indicator (EMI) lost 28 cents for the series, closing at 1,873 cents. After getting within 11 cents of the 2,000 cent barrier last month, the EMI has now dropped on 8 of the last 10 selling days, losing a total of 116 cents across this run.
Understandably, the passed-in rate climbed this week as sellers were either unwilling or unprepared to accept the lower prices on offer. 15.3 per cent of the offering failed to reach seller reserve.
The skirting market followed a similar path to the fleece. Good style, low vegetable matter skirtings (less than 3.0pc) attracted good competition and were less affected by the falling market, but still 20 to 30 cents easier. Lesser style, higher vegetable matter types were highly irregular.
After weeks of rises the crossbred sector recorded large losses in this series. In the south, the MPGs for 26 to 28 microns dropped by between 42 and 50 cents. The oddment market also dropped, general losses in the stains, crutchings and locks of between 10 and 30 cents were reflected in the Merino Carding Indicators (MC) which fell by an average of 18 cents.
The market now heads into the three week mid year recess. Sales will resume in the week beginning Monday 17 August.
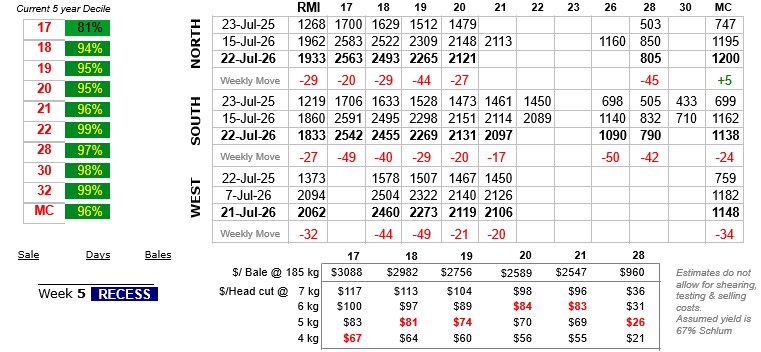 Table showing wool prices to 23 July 2026
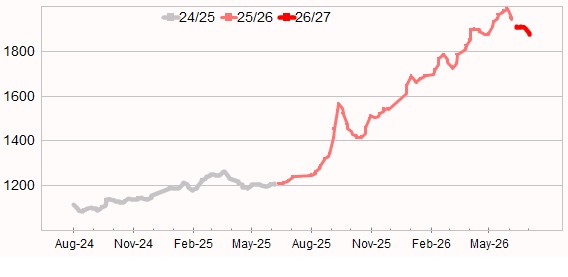 Graph showing Eastern Market Indicator (EMI) to 23 July 2026
For full details of auction sales, download the reports below.
Disclaimer: The information contained in this article is given for the purpose of providing general information only, and while Elders has exercised reasonable care, skill and diligence in its preparation, many factors (including environmental and seasonal) can impact its accuracy and currency. Accordingly, the information should not be relied upon under any circumstances and Elders assumes no liability for any loss consequently suffered. If you would like to speak to someone for tailored advice relating to any of the matters referred to in this article, please contact Elders.